
The Social Housing Phenomenon, part 2: how much does it cost, and who gains?
£6.1 billion per year is spent on implied subsidies to foreign-born headed households in social housing alone
Executive Summary
Social housing is an enormous part of the British state, little understood in terms of who gains from it, and even less in terms of how much is gained. This is because, by renting out at below-market rates, it represents a large, hidden, ‘off-balance sheet’ transfer from taxpayers to favoured groups who have been allocated homes.
In 2024, the total ‘general needs’ housing stock in England has an implied rental subsidy of around £19.1 billion, or 0.8% of GDP. This represents the difference between the private sector rent which could be charged, given locations and sizes, and the social housing rent which is charged.
In 2021, 31% of social housing subsidies (across all categories of social housing) went to households headed by somebody born outside of Britain, or £6.1 billion, with each socially rented household gaining £7,651 in implied rental subsidy that year, substantially above that of socially rented households headed by people born in Britain.
In 2021, black-headed households gained far more in social housing implied rental subsidies than other groups, £3.3 billion in total. This means that 4% of England’s population gain 17% of the subsidies.
Immigrants arriving in the three years before the 2021 Census were receiving an estimated £316 million in implied rental subsidies, despite there being rules in place to constrain new immigrants’ access to welfare and other state support.
Households in London headed by working-age economically inactive, unemployed and full-time students in 2021 received implied rental subsidies worth £2.7 billion.
Modelling assumptions on discounts and yields and validating them against London boroughs’ own estimates of their social housing assets’ value, London’s social housing in 2024 was an asset portfolio worth £210 billion. Applying much more cautious assumptions, the rest of England’s social housing could be worth a further £215 billion if it were to be sold to private investors.
Although asset sales would create valuable fiscal space for the British state, the best argument for privatising social housing would be the opportunity for substantial economic rationalisation, allowing for much greater redevelopment of current housing sites and a turnover of tenancies to those better able to contribute to London’s rich jobs market.
The Social Housing Phenomenon, part 1: a brief recap and some rebuttals
Britain has a housing market under great pressure
According to the ONS’s Price Index of Private Rents, in February this year the median rent was £1,326 per month. That average conceals substantial disparities. The central London housing market is highly prized because in Britain’s troubled economy, residing there gives access to a labour market with continued deep strengths in finance, insurance, and legal services (among other things). When this is combined with London being the seat of government, it’s the place where most of the ‘good jobs’ are. Consequently, rents in Greater London rise to £2,235 per month on the latest data. If you go to the most sought-after parts of central London, they go much higher; in Kensington and Chelsea, for instance, £3,643 per month, and if you want four bedrooms there, £5,638 per month. Remember that these are median rents, and many tenants will pay substantially more for the most desirable locations and conveniences, but just getting a family home on the open market in central London is extremely expensive.
Given Britain’s sluggish economy, why is housing so expensive? And, even more importantly, why is it getting more expensive? Over the last ten years, median rents across the UK have risen by 45%, faster even than the already-rapid rate of inflation (36%). The explanation is simple: supply is highly constrained because in 1947, land use was put under a regime of socialistic central planning, where building homes is illegal by default, such that we have a large deficit in the number of homes relative to demand; meanwhile, demand has been constantly ramped up by governments committed to extreme mass immigration, which has added over four million to this country’s population in the last decade alone. The interaction of squeezed supply with accelerating demand has had the exact effect that basic economics would predict — although many economists are uncomfortable talking about the demand-side, because it might affect dinner party invitations.
Social housing is the one type of housing which Britain has in relative abundance — of the thirty OECD economies listed, only three have a higher share of social housing — reflecting a fairly typical (if still definitely on the high side) social housing supply by international standards, while all other tenures are deficient. Social housing is built and operated by local government and by independent providers, known as Registered Social Landlords (RSLs). The role of social housing is to supply housing at below-market rents allocated on the basis of ‘need’, which in the end reflects a political equilibrium over preferred groups. In the early days of social housing, before the ’70s, this would often favour Britons who demonstrated solid working class virtues; people with jobs, who were usually only given a subsidy of around 10% when comparing to (albeit rent-controlled) market rates. But since 1977, councils have been forced to prioritise people based on ‘assessed need’, meaning that social housing allocation now favours a very different set of qualities; meanwhile, the size of the subsidy involved has spiralled.
Social housing allocation matters
The original article, ‘The Social Housing Phenomenon’, highlighted important consequences of those bureaucratic preferences in allocating housing to different groups. That caused some waves because, using 2021 Census data, it found that large shares of the social housing stock were home to people born abroad, sometimes non-citizens, and sometimes non-citizens who arrived here very recently indeed. These patterns were concentrated in London, where fully 47.6% of social housing is occupied by a household headed by somebody born abroad. Further analysis showed that white British households were substantially under-represented in social housing, especially in London, and that people of certain national origins — for example, Somalis — were extremely concentrated in social housing in London. For instance, to continue with the Somali case, 73.9% of Somali-headed households in London are currently benefiting from the substantial rent subsidies this implies.
The focus on London, and especially central London, is because it really is one of the highest-value property markets in all of Europe. In contrast to many major European cities, social housing is more present in the centre than the periphery of the city, making the rent subsidies particularly large, and their arbitrary allocation of great social consequence. A good contrast is Paris, where social housing has long been placed on the periphery of the city. Central London is the heart of Britain’s economy, and yet too few people can actually afford to live near to where they work, resulting in them having to share crowded private-rented homes or commute long distances, lowering their return to working in the capital and limiting the opportunity for more to do so. In an economy struggling to grow, these facts seem particularly pressing.
Mythbusting the Social Housing Phenomenon
Since the appearance of ‘The Social Housing Phenomenon’ eighteen months ago, the attention it has gained has resulted in plenty of criticism, most of which proves to lack substance upon closer examination.
‘Social Housing isn’t subsidised! Tenants all pay rents!’
Below-market rents are a state benefit, which tenants chosen by housing bureaucrats receive. Social housing advocates will tell you that this isn’t true, and that social housing has to be run to cover its costs, through a mechanism called the Housing Revenue Account, which has to cover the cost of building, maintenance, and repair — although building is financed with assistance from Homes England. (You can read more about the finances behind Homes England, and the dubious nature of the Housing Revenue Account, here.)
Leaving those grants aside, ‘covering costs’ is fiscally neat as an explanation, but economically nonsensical: a state asset rented out below its market rate is logically an asset given with a subsidy. Imagine, if you will, that a friend of yours moves to Kensington and tells you that she is paying a ‘full rent’ for her one-bed flat, covering all costs. Then you find out that the flat she lives in was purchased in the ’70s by her aunt, and she is only paying £800 per month because that’s all it costs to keep the place in good condition, even though it would be worth over £2,500 per month on the open market. Could your friend’s aunt receive a much larger income if she rented out the flat on the open market? Yes. Is the sub-market rate rent therefore a transfer from an aunt to her niece, your friend, which is not available to you, not being so chosen for favour by said aunt? Obviously, also yes.
‘Foreign-born tenants are irrelevant! Most of them are British!’
Using country of birth to trace the impact of immigration on social policy questions is entirely standard practice, because it captures the lasting impact of immigration and avoids being distorted by arbitrary and changing naturalisation rules (as the last couple of weeks should prove). In the case of social housing, if pronounced numbers of immigrants end up in social housing, then that’s an important data point in helping us understand the costs and benefits of past immigration policy. If next year the government gave all resident foreign nationals full, automatic citizenship, would the impact of immigration, positive or negative, therefore be zero? Obviously this would be an idiotic position to take: those people are still immigrants.
Similarly, if your parents arrived in the ’80s and naturalised in the ’90s before you were born, it is normal to think of you as having an ‘immigrant family background’. People claiming that ‘foreign-born’ is some kind of pernicious, race science terminology are blinded by ideology or lying to suppress discussion. In either case, they should be ignored. Even the notorious open borders zealot Jonathan Portes has used place of birth as a distinction in his research papers: this is entirely a non-argument.
‘Yes, but other measures show smaller shares, you’ve chosen this one for maximum impact!’
Firstly, that’s journalism. But, secondly, and more importantly, other measures show smaller shares, but they also show different — often worse — things. For example, we can pick out that in the Census, 6.5% of socially housed households were headed by a foreign national (12.3% in London), and that’s lower than the 19.2% of foreign-born households (47.6% in London). But the difference here, as social housing advocates like to highlight, is that many foreign-born households are naturalised and so can be argued to have some legitimate access to public services as citizens. By contrast, most British people are quite surprised to find that significant numbers of subsidised homes (especially in central London, where the subsidy is largest) are being rented out to actual foreign nationals at all. The 6.5% isn’t a ‘better’ number here, and you don't grasp public sentiment if you think it is.
Other critics seek to sidestep the Census entirely, and focus on more recent data on new lettings to foreign nationals and ethnic minorities, which suggest lower levels than the Census: 13% of new social lettings in 2023/24 to foreign nationals, and 20% to ethnic minorities. But there’s an important and instructive difference here: lettings are a flow measure, whereas the Census measures stocks. If, over time, fewer lettings, the flow, go to foreign nationals and ethnic minorities than the Census suggests of the proportion of social housing taken up by them, the stock, that’s because they tend to be stickier tenants; rather than social housing being a temporary leg-up into the housing market, once they get hold of the subsidised asset, they are less likely to let it go.
‘Immigrants can’t even get social housing! This is all just untrue!’
The final defence on the social housing question is that immigrants can’t get social housing, at least not until long after they have settled here (achieving permanent residency or citizenship), so it’s clearly all made-up Daily Mail nonsense. The argument then goes that the path to social housing is actually a lot stricter for immigrants than for those living in Britain, and therefore any suggestion that they are receiving greater benefit from social housing just can’t be true.
This argument is based on the fact that immigrants to Britain come under visas stipulating ‘No Recourse to Public Funds’ (NRPF). The idea of NRPF is that immigrants can only be resident while they can support themselves, and if it comes to the point where they need social assistance, then they should leave the country (or be deported, like that ever happens). NRPF means that immigrants can’t access most welfare benefits (including help with rent), and that councils can’t include them in allocating council housing.
But the fact is that NRPF is only a limited constraint. It doesn’t apply to refugees at all, and that fact alone has allowed refugees’ share of new social housing lettings to grow from 0.3% of social housing lettings in 2013/14 to 2.0% in 2023/24. But even for those not counted as ‘refugees’ (already a highly dubious category under current law), NRPF can be waived: there is a process for Change of Conditions, where ‘…they are destitute or at risk of imminent destitution’. You read that right: NRPF is supposed to protect the British taxpayer from destitute immigrants accessing social assistance, but it can be waived at the moment they become destitute! If you have children, then the problem is more easily solved: because of the Children Act 1989, a child identified as being ‘in need’ requires a ‘human rights assessment’ by the local authority which can get past all of the NRPF restrictions. Needless to say, YouTube is full of videos giving advice to immigrants seeking to overcome the low bar of NRPF. Regardless of whether these exemptions and provisions are right or wrong, this seriously undermines the claims of our critics.
And, even more importantly, in terms of social housing, a lot of this is academic anyway. This is because the majority of the stock is now owned and let by RSLs, not by councils, and although RSLs are entirely creatures of the state, because the subsidy is implied rather than direct they are able to operate their own allocations, and NRPF doesn’t apply.
So it’s true that NRPF exists, and it does indeed offer a degree of constraint on foreign access, but the existence of NRPF doesn’t contradict the widespread presence of foreign nationals and foreign-born people in social housing, as all the data will show. The more that you view NRPF’s constraint as important, the more you have to accept that the number of foreign tenancies is in fact quite remarkable.
Costing up the Social Housing Phenomenon
Whereas the original ‘Social Housing Phenomenon’ article focused on who gained from social housing, this article adds an extra element: understanding how much is gained from social housing. Our purpose is to try to quantify the implied subsidy of holding social housing, given the benefit of obtaining housing at below-market rates.
The underlying calculation is quite simple. For a given house in a given local authority, we have the number of social homes, and we also have data on market rents and rents for social homes. By taking the median market rent and the median social rent, and multiplying the difference in rents by the number of social homes, we can then obtain the implied subsidy. To go back to our earlier example of your friend paying £800 per month for her aunt’s flat in Kensington, when it would actually realise £2,500 per month on the open market, that means your friend benefits (and her aunt loses) £1,700 per month in implied subsidy.
Homes come in different sizes, and for that reason we add two additional steps: first, we break down rents by the number of bedrooms; we then adjust for average floorspace. Because of data availability, we combine studios into one-bedroom homes, and we combine all homes with four or more bedrooms into one category. That gives us, for each local authority, four segments to compare. We also capture the rents for local authority and private registered providers separately, as their rents can differ somewhat. The English Housing Survey (EHS) tells us that, on average, social housing units are somewhat smaller than private rental units (66 square metres against 75 square metres), and so we apply an adjustment factor to shrink relevant private sector rents pro rata, taking 12 percent off the private sector median rent. (This is a highly conservative assumption. It may be that some of the smaller size reflects different bedroom size composition or regional mix, but the EHS doesn’t tell us that, meaning we will err on the side of caution.)
A quick example, using one of the most expensive boroughs in the entire country, will show readers what we are doing, as well illustrating the sheer sums of money that are involved. In Kensington and Chelsea, looking only at local authority registered providers, in March 2024, there were 6,440 social homes, including 264 homes with four or more bedrooms. A house of that size on the private market fetches a typical rent of £5,186 per month, compared to a social rent of £185 per week for a four-bedroom home, or £204 for a five-bedroom home. Taking account of the relative volumes, we find that the average social rent per calendar month is £806 per month for a four or more bedroom home, which means an implied subsidy of £4,380 per calendar month, falling to £3,758 with our floor space adjustment. Across the year, adding the subsidy across those 264 homes, that means £11.9 million in implied subsidy to social housing tenants in these homes. Performing the same exercise across all size categories means that for the 6,440 local authority rental homes, there’s an implied subsidy of £155.5 million in 2024. Perform the exact same exercise for private registered providers, outside of the local authority sector and looking only at ‘General Needs’ social housing (there are a range of other categories), and we can add another £191.4 million in implied subsidy. So, in just one local authority — admittedly, one of the most expensive — in just one year, the taxpayer was giving away social tenants £346.9 million in renting these homes out at far below market rates.
Such an approach obviously has lots of limitations. Within a local authority area, social housing is not typically in the most desirable parts (though this is often, at least in part, precisely because of the social housing and the sort of tenants it is allocated to). There are questions over quality — although, if the quality of social housing is so bad, is social housing a desirable public policy anyway? Any attempt to model the costs top-down confronts a lot of complexity, and the approach here seeks to find a balance between the impracticality of reviewing every item in the social housing estate and achieving a reasonable baseline with conservative assumptions. While more complex economic analysis can be applied to the problem, such as examining the second-order impact of social housing upon the market, or attempting to take into account richer data on floor space or quality considerations, this rough-and-ready calculation should give a good baseline of the costs involved.
Once we have the subsidies quantified in this way, running the numbers for 2021 allows us to compare how rent subsidies are distributed in terms of different demographic and social categories, so we can bring the how much question back to the who question: who gains what benefits from the allocation of social housing at the expense of the British taxpayer?
The headline: £19.1 billion in rent subsidies for ‘general needs’ social housing
We can run that same headline analysis for every local authority in England in March 2024, and we get 3.24 million social homes accounted for, with £19.1 billion in implied rent subsidy: an average of £5,897 per social home. This isn’t an exhaustive analysis: there were, in fact, 4.24 million social homes in total across England’s local authorities and private registered providers, with the remainder accounted for by a range of specific categories; for example, houses dedicated to the elderly and disabled. We are excluding these homes for now, as these are not what has become so controversial about social housing allocation.
Averages always conceal broad variations, and those variations are interesting. Unsurprisingly, it’s Kensington and Chelsea which leads among local authority areas, with the average social home giving tenants a £23,542 rent subsidy for the year. Westminster (£23,063) and Islington (£16,962) follow behind. Outside of London, social housing tenants in Bristol gain £10,149 in rent subsidy; in Brighton and Hove, £9,788; and in Cambridge, £9,437. All of these are known to be expensive places to live. But in Manchester, a more broadly representative city, a social home still has an average implied subsidy of £7,266 for the year; and even Hartlepool sees tenants gaining £406.
Differences in subsidy reflect not only differences in private rents, but the composition of the social housing stock. Adding bedrooms means a rapid increase in the level of implied rental subsidy. Across England, a one-bedroom social home represents £4,419 in implied rental subsidy; a two-bedroom social home, £5,571; a three-bedroom social home, £6,512; and four or more bedrooms a whopping £14,031. The sheer size of the typical four or more bedroom subsidy isn’t only because it includes five- and sometimes six-bedroom properties in the calculation: it is also because 33% of four or more bedroom social homes are in London, where the subsidies are also highest. This point will be important when we consider who, exactly, gains the most from social housing.
Overall, £8.8 billion of taxpayers’ money is lost each year in implicit rental subsidies in London, and a further £2.5 billion in the South East. This, in theory, could go a little way towards rebalancing the scales of Britain’s regionally-skewed public finances: London benefits more from social housing subsidies than most regions, because the assets purchased by the taxpayer have such a high value. But, as we shall see, this is completely the wrong way of looking at it: this is not a general benefit to ‘Londoners’ (a vague concept these days), but one which gets focused in very particular ways.
Cui bono? Back to the 2021 Census
To explore this question we have to go back a few years, using data from the 2021 Census, which allows us to see not only the difference in rents for different households, but also who made up those households. That means we must step away from looking at the specifics of social housing types, and focus more on the composition of tenants. For that reason, we get a more complete coverage of the social housing stock, with around 4 million households covered. The total subsidy figure for 2021 that interests us here is therefore £19.6 billion. (The 2021 figure, when comparing to the previously mentioned 2024 figure of £19.1 billion, is different because of inflation since 2021, which increases the 2024 figure, and the inclusion of other types of social housing, which increases the 2021 figure.) While this is not ideal, this is not avoidable given the data that is publicly available. Still, the figures here should give a good, general picture of the situation.
In breaking down the numbers, we rely on a few different metrics. It’s worth briefly clarifying why they’re interesting. For a given group:
The total subsidy is the total imputed private rent for social housing tenants minus the social rent they’re estimated to pay, aggregated across all social rent households.
The subsidy per social rent household takes the total subsidy and divides it by the number of social rent households. This reflects the direct benefit that a social rent household is receiving by benefiting from housing policy decisions.
The subsidy per working age person takes the total subsidy and divides it by the number of working age people in that area and/or group, regardless of whether they rent socially or not. This reflects the fact that working age people are those working to produce the economic output that pays for the subsidy (implicit or not).
As we have already seen, across England the total subsidy was £19.6 billion. Per social rent household, this was £4,903; per working age person, this was £552. These latter two figures give us benchmarks for the rest of the analysis at England-wide level, but the discussion also repeatedly zooms in on London. For this reason we provide the same benchmarks for London as a whole, as well as for Central London specifically.
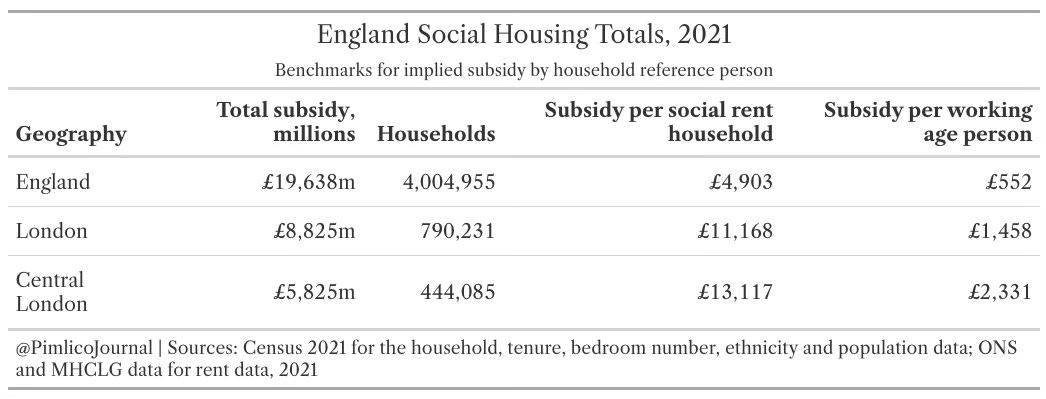
The headline figures alone should highlight the importance of London in quantifying the cost of social housing: London’s subsidy per social rent household is more than double that of England as a whole (and is more than triple per working age person), and rises further still in Central London. That’s caused chiefly by higher rents, but the even sharper increase in subsidy per working age person — from £552 across England to £2,331 in Central London, more than quadruple — reflects also the higher density of social housing in the heart of the capital.
If you’re reading this in a cramped bedroom in Central London and you’re not feeling you’re gaining £2,331 in benefit from social housing — that’s the point. Most people don’t have access to social housing, but every taxpayer is paying for it, even if it is in the form of subsidised rent rather than direct cash. It logically follows that if these houses were rented at private sector rates in 2021, every taxpayer in England could have had a £552 tax cut.
Social housing is a local phenomenon
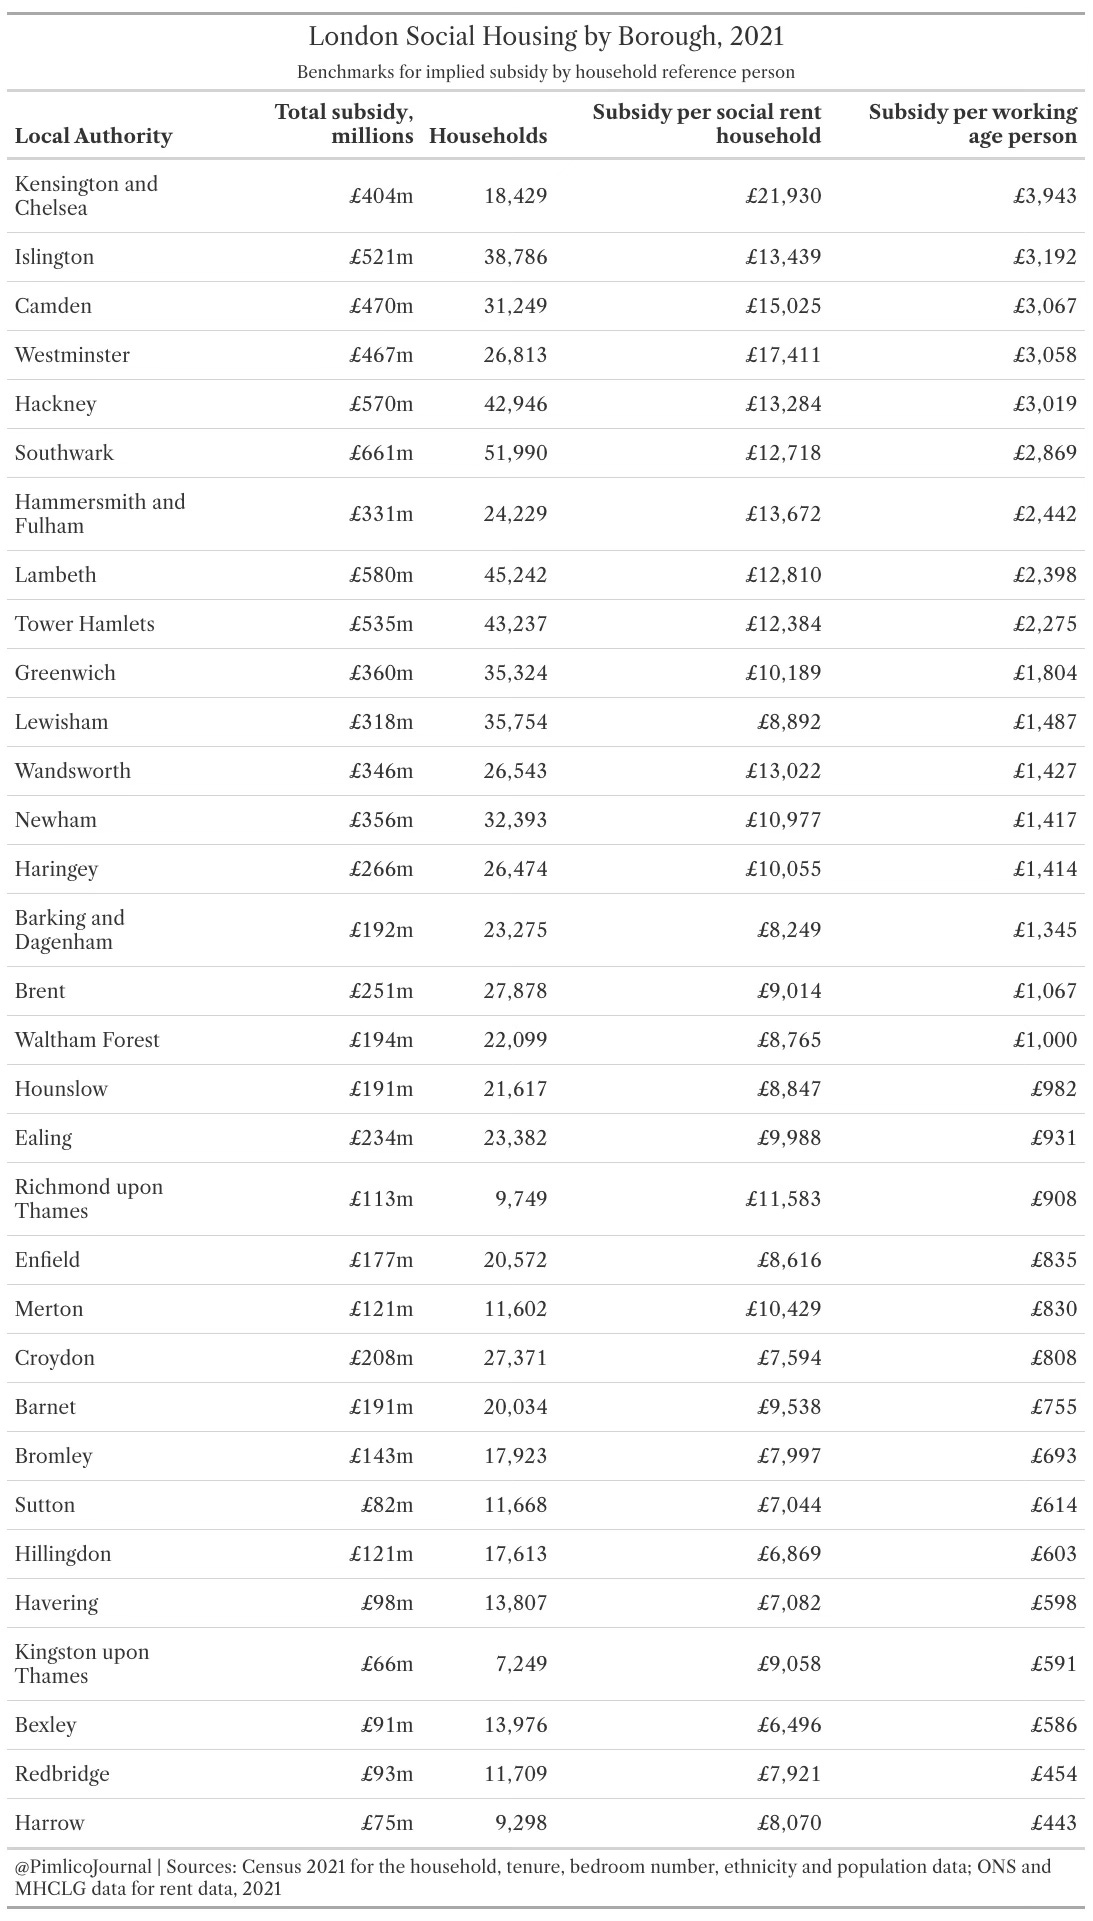
We can dig down deeper, looking at the allocation of the £8.8 billion subsidy across London by breaking it up at the borough level. Ranking by subsidy per working age person, we can see that Kensington and Chelsea is the most expensive borough, with nearly £3,943 per working age person to support subsidies of over £1,800 per calendar month for the average socially renting household in the borough.
Southwark represented the largest total subsidy, estimated at £661 million in 2021. To put this in perspective, the total Southwark Council budget in 2020-21 was £874 million; the social housing estate in the borough gave those few lucky enough to hold a tenancy a windfall nearly as large as the amount spent on schools, care and other services. Remember, most people aren’t so lucky: the mean Southwark tenant household gained £12,718 from subsidised rent, while the mean Southwark working age person (implicitly) lost £2,869 to pay for it.
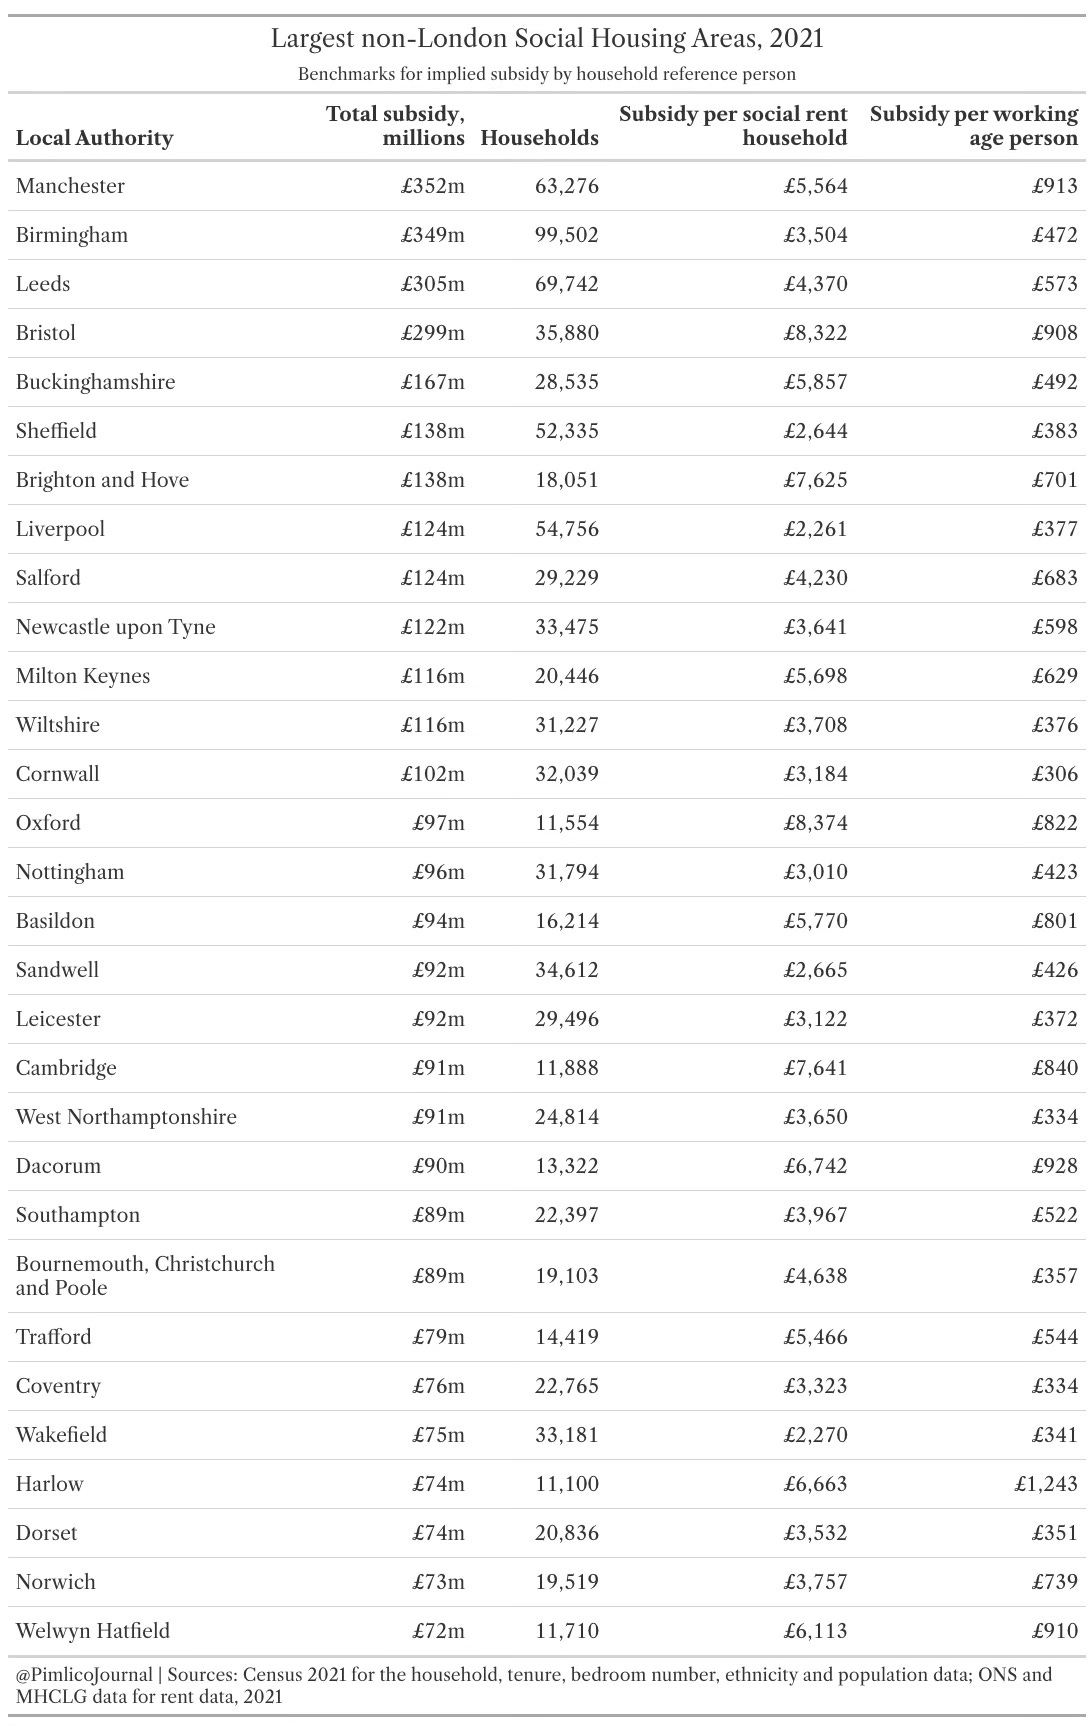
Reflecting what we’ve already seen, implied subsidies fall off quickly outside London, but the sums can still be significant. Below, we list the top thirty local authorities beyond the capital by total subsidy. Unsurprisingly, England’s largest local authorities, Manchester and Birmingham, top the list, with £352 million and £349 million in total implied subsidy respectively. As most readers are surely aware, Birmingham is now bankrupt because of equal pay law. That extra half-a-billion in public revenue might come in handy.
The wide range of rent subsidy levels is important here. Much lower private rent levels outside London make for a very different unit level outcome. Some are still very high: expensive places like Bristol (£8,322 per household), Oxford (£8,374), Cambridge (£7,641), or Brighton and Hove (£7,625) stand out, reflecting their high-cost housing markets. But even in cheaper areas, there are still substantial sums involved. For example, in Liverpool, one of England’s poorest major cities, a social housing tenant still gains nearly £200 per month in implied subsidy. If this was available in cash, it would be highly prized — just as social housing is, at least in practice. (For the record, Pendle, in Lancashire, has the lowest subsidy per social rent household in England, at £73 per month.)
So much for the aggregate picture. Given the disconnect between the implicit subsidies gained by tenants and the experience of the majority losing out from uncharged rent, we should now turn to the picture of who exactly is gaining these subsidies, and by how much. We can do that by using Census breakdowns into different dimensions, and add further metrics to help understand what they mean: breaking up the total population into various groups, and working out their share of the total subsidy.
Country of birth
Across the entirety of England in 2021:
18.2% of households were headed by somebody born outside Britain, representing 17.3% of the total population.
19.9% of socially renting households were headed by somebody born outside Britain.
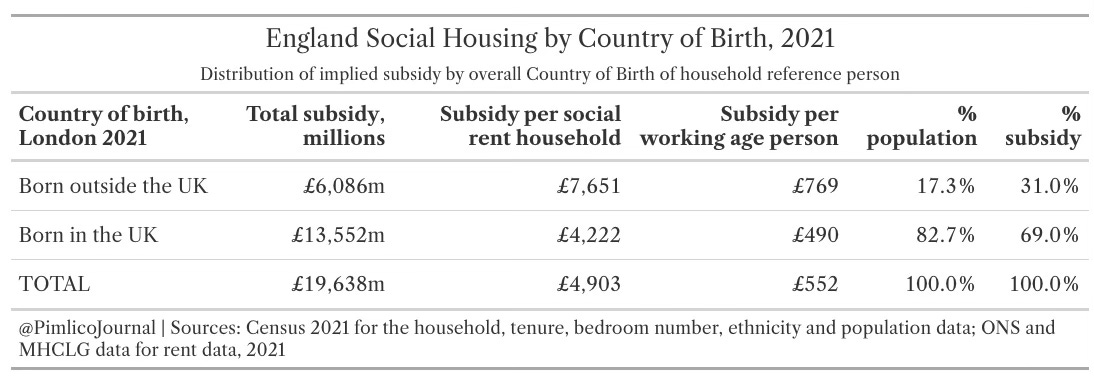
£6.1 billion, or 31% of the total yearly value of the rent subsidy from social homes, were received by households headed by somebody born outside Britain.
On average, a socially renting household with a head of household born outside of Britain received £7,651 per year in implied rental subsidy in 2021, compared to £4,222 per year for a socially renting household headed by somebody born in Britain. Across all working age people, regardless of housing tenure, those born outside Britain received an average of £769 per year in social rent subsidy; by contrast, those born in Britain received an average of £490 per year.
There are three factors which explain why households headed by somebody born outside of Britain gain so much more from social housing. First, as we have already seen, they are simply over-represented in social housing. Second, they are heavily over-represented in larger social homes: 7.2% of foreign-born headed households are in a home with four or more bedrooms, compared to 3.8% of British-born headed households, with the difference primarily found in British-born headed households being over-represented in the smallest, one-bedroom category.
The third reason is London: 9.2% of British-born headed households living in social housing are in London, compared to 37.8% of foreign-born headed households. These factors compound one another: 60.3% of social rent homes with four or more bedrooms in London (by far the highest-cost category) are occupied by foreign-born headed households. There are 31,000 households in this category, each receiving an average subsidy of £21,595; and again, the majority of these households, 18,000 of them, are in inner London, with an average subsidy of £26,106 per year, representing £564 million in rental subsidies. Fully 70% of foreign-born headed households’ social rent subsidies are received in London, and 50% in central London.
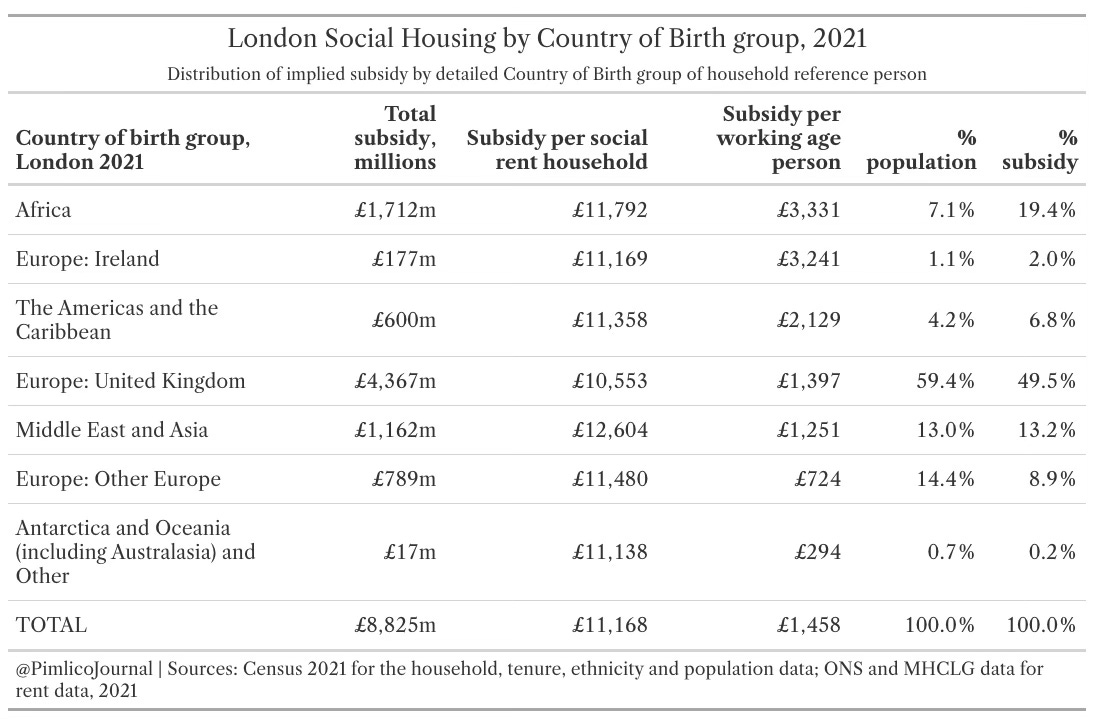
London’s greater population density also allows for further breakdown of where social housing tenants come from. We can see, for example, that African migrants, accounting for 7.1% of the population, receive 19.4% of social housing implied subsidies, with a typical gain of £3,331 averaged across working-age people, more than double the London-wide average. By contrast, European and Oceanian immigrants receive much less than the average: European adults gained half the London typical rate (£724), and Oceanians less than a quarter (£294), because of how few socially-housed households are headed by people from these groups of countries.
Recent arrivals
Foreign-born heads of household include people who were born in the British Empire and arrived in the immediate postwar decades, and have been in Britain ever since. But they also include people who are, in the colloquial phrase, ‘fresh off the boat’. The Census allows us to explore how the benefits of social housing to these households differed by time of arrival.
This analysis is interesting because it shows that immigrants who arrived from the ’70s to the ’90s have secured some of the greatest average gains from social housing. In each case, households headed by people born abroad but arriving in this period see substantial gains on a per working age person basis, well above national averages. In all cohorts arriving before 2011, the share of subsidy outweighs the share of population, reaching notably high levels for those arriving from the ’80s onwards, and especially in the ’90s and ’00s — collectively, those arriving between 1981 and 2010 gained 21.4% of the implied rental subsidies of English social housing.
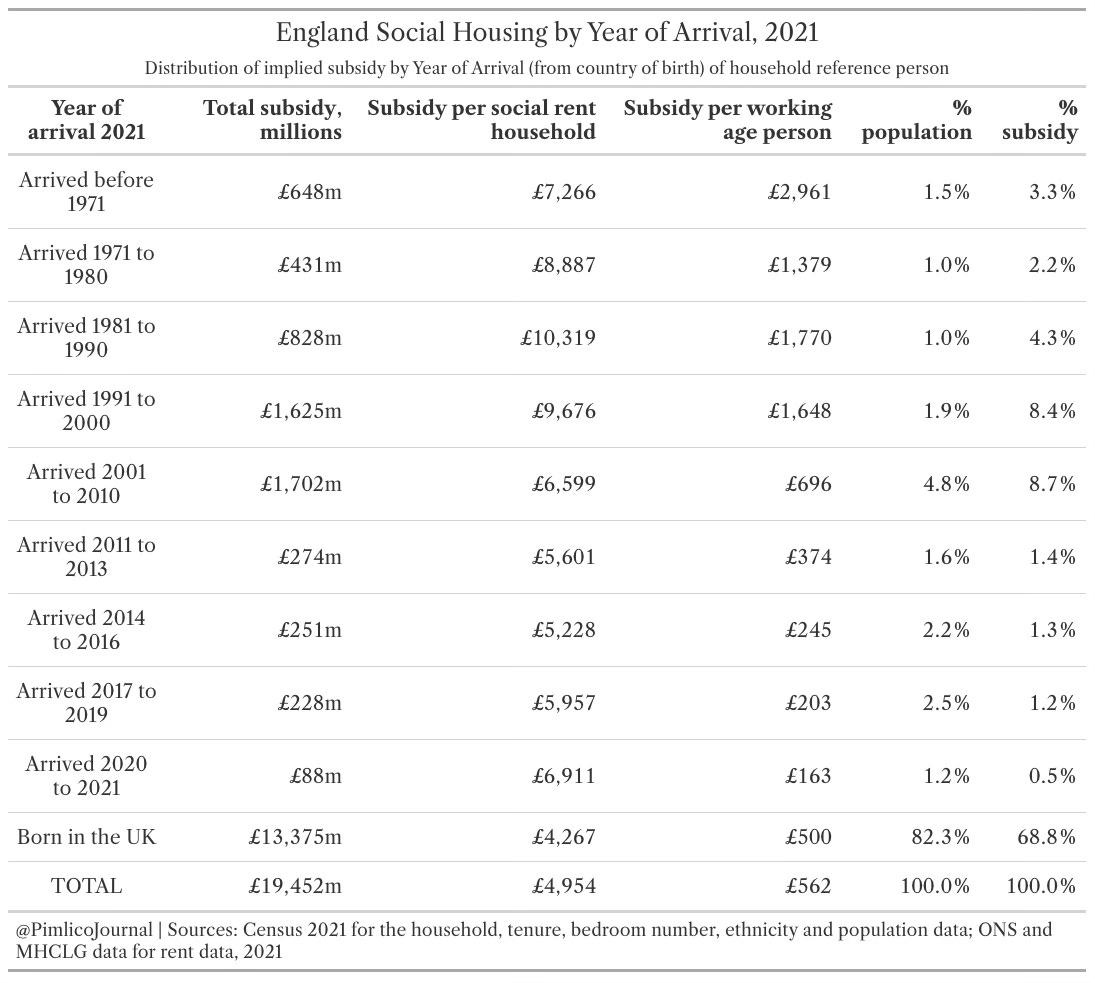
From 2011, the share of subsidies falls off, but this reflects in part the interaction of some constraint from No Recourse to Public Funds (NRPF) conditions. It would still be surprising to most people to find, for example, that immigrants arriving into Britain just twelve months before the 2021 Census was taken were heading households gaining £88 million in implied rental subsidies.
Given the commentary about it being ‘impossible’ for recent immigrants to obtain social housing, it is interesting that fully 51,000 households who arrived in the three years leading up to the 2021 Census (i.e., from 2017) were benefiting from social rent; or, in financial terms, a combined gain of £316 million in yearly implied rental subsidies, 1.7% of the total. It is particularly telling that across households regardless of tenure, it is only the most recent arrivals who receive lower subsidies per working age person than those born here, reflecting that there are still some effects of NRPF conditions in limiting access to social housing.
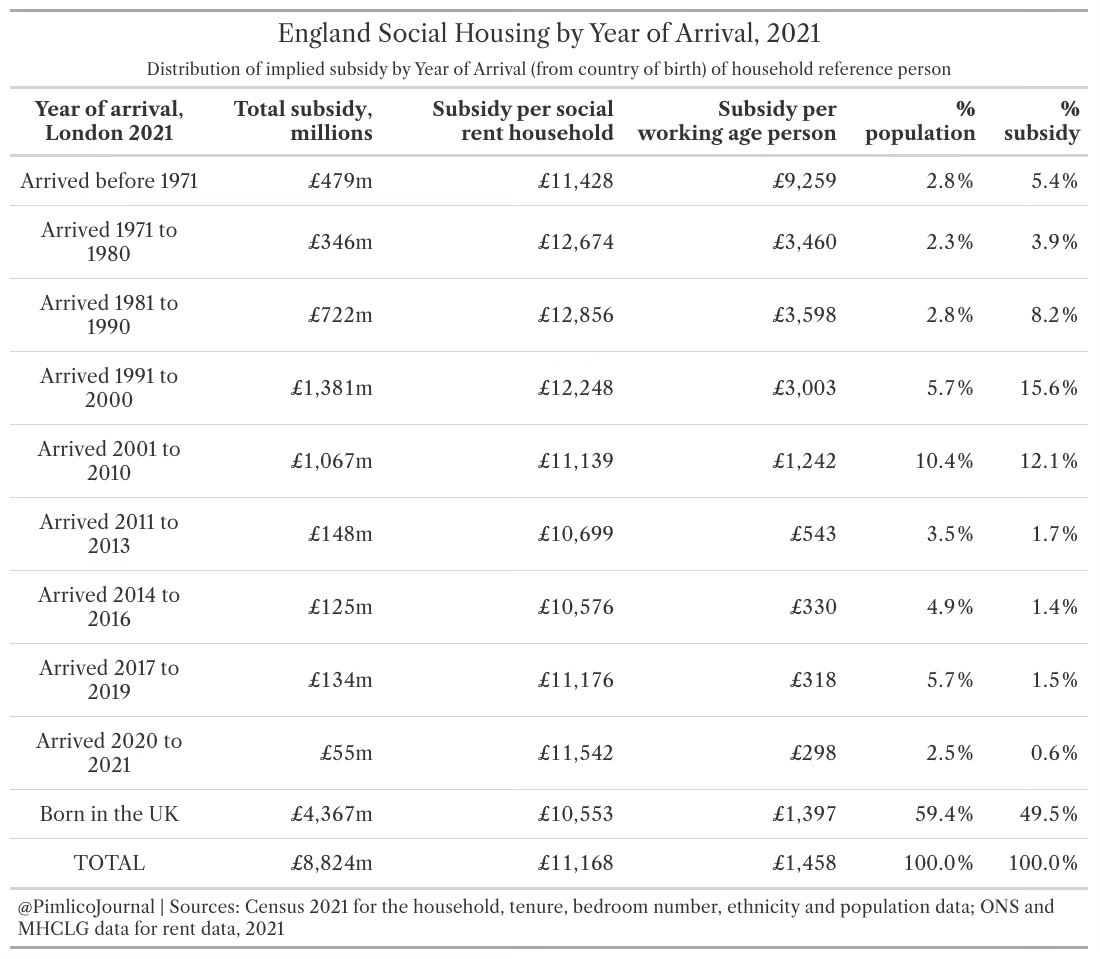
Again, we can look at London specifically, which gets at the capital’s role in the wider housing market, but also as the main channel of entry for new migrants. Here, the share of subsidies for arrivals between the ’80s and ’00s reaches 35.9%, with ’90s immigrants alone capturing 15.6% of implied rent subsidies in the capital — but even migrants arriving in the three years before the Census was taken gain 2.1% of total subsidies!
Ethnic minorities
Mass immigration is by now a multi-generational phenomenon in Britain, and understanding its lasting impact, and making policy decisions accordingly, can only easily be done by comparing the outcomes for different ethnic groups. It is also the case that at the local level, different ethnic groups have become concentrated in different areas and had an impact on local institutions, especially social housing.
The central finding is that white British people, the state-forming ethnic group with deep ancestral roots in Britain, are under-represented in the use of social housing, and are especially under-represented in the receipt of implied rental subsidies: 73.5% of England’s population is white British, but they receive only 60% of the implied rental subsidy, or £11.8 billion per year. The typical white British socially rented household gains £3,950 in implied subsidy, the lowest of any group.
(NB: The Office for National Statistics has very long names for each ethnic group such as ‘Black, Black British, Black Welsh, Caribbean or African’, which I have truncated to the basic term for readability.)
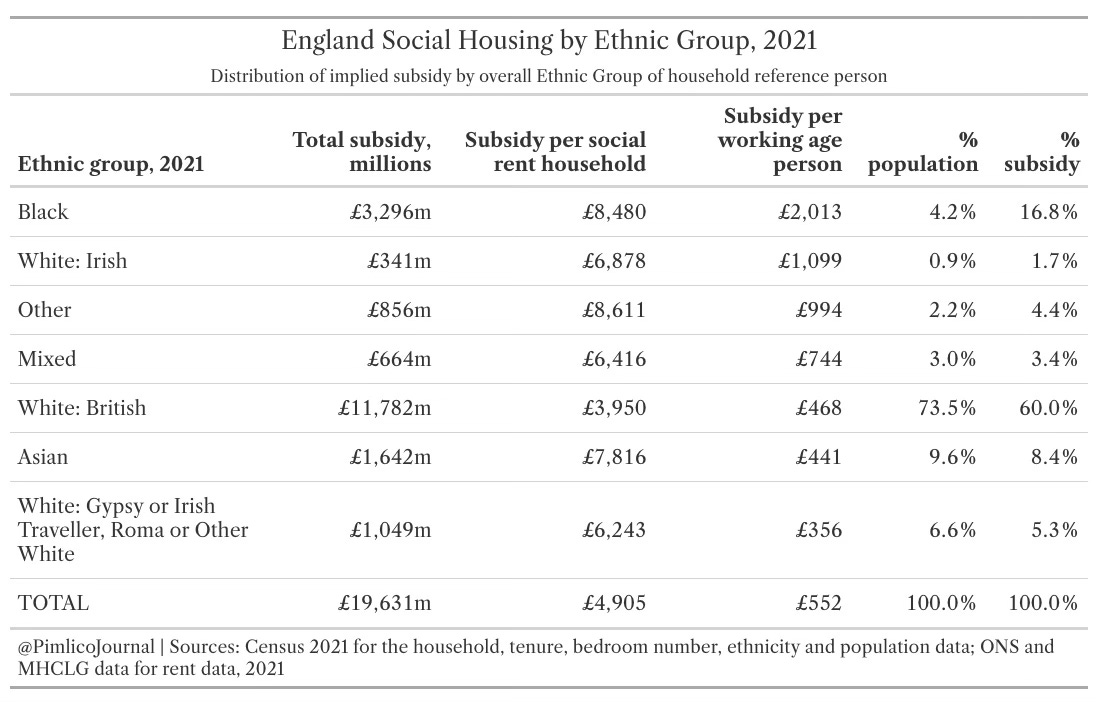
The most over-represented ethnic group is black people, who accounted for 4.2% of England’s population, but 9.7% of socially rented households. Those households account for 16.8% of all implied rental subsidy, or £3.3 billion per year. The average white British working age person, regardless of tenure, receives £468 in rental subsidy; meanwhile, the average black working age person, regardless of tenure, receives £2,013 in rental subsidy, four times that of their white British counterparts. Black-headed households are twice as likely to be socially renting than the wider population and receive nearly twice as much rental subsidies as that figure alone would suggest, mainly because of their heavy concentration in London. It is notable that at the England-wide level, Asian people have a below-average gain from social housing, with 9.6% of the population receiving 8.4% of the subsidies.
Analysis using richer ethnicity categories is possible within London because of the greater population density, and it is valuable to unpack these patterns in more depth. We can see, for example, that some groups depend heavily on social housing in the capital. Black people, split across three categories (Caribbean, African and Other) had 13.5% of London’s population in 2021, but received an estimated 30.1% of London’s implied rental subsidies from social housing: a total of £2.7 billion in the capital alone.
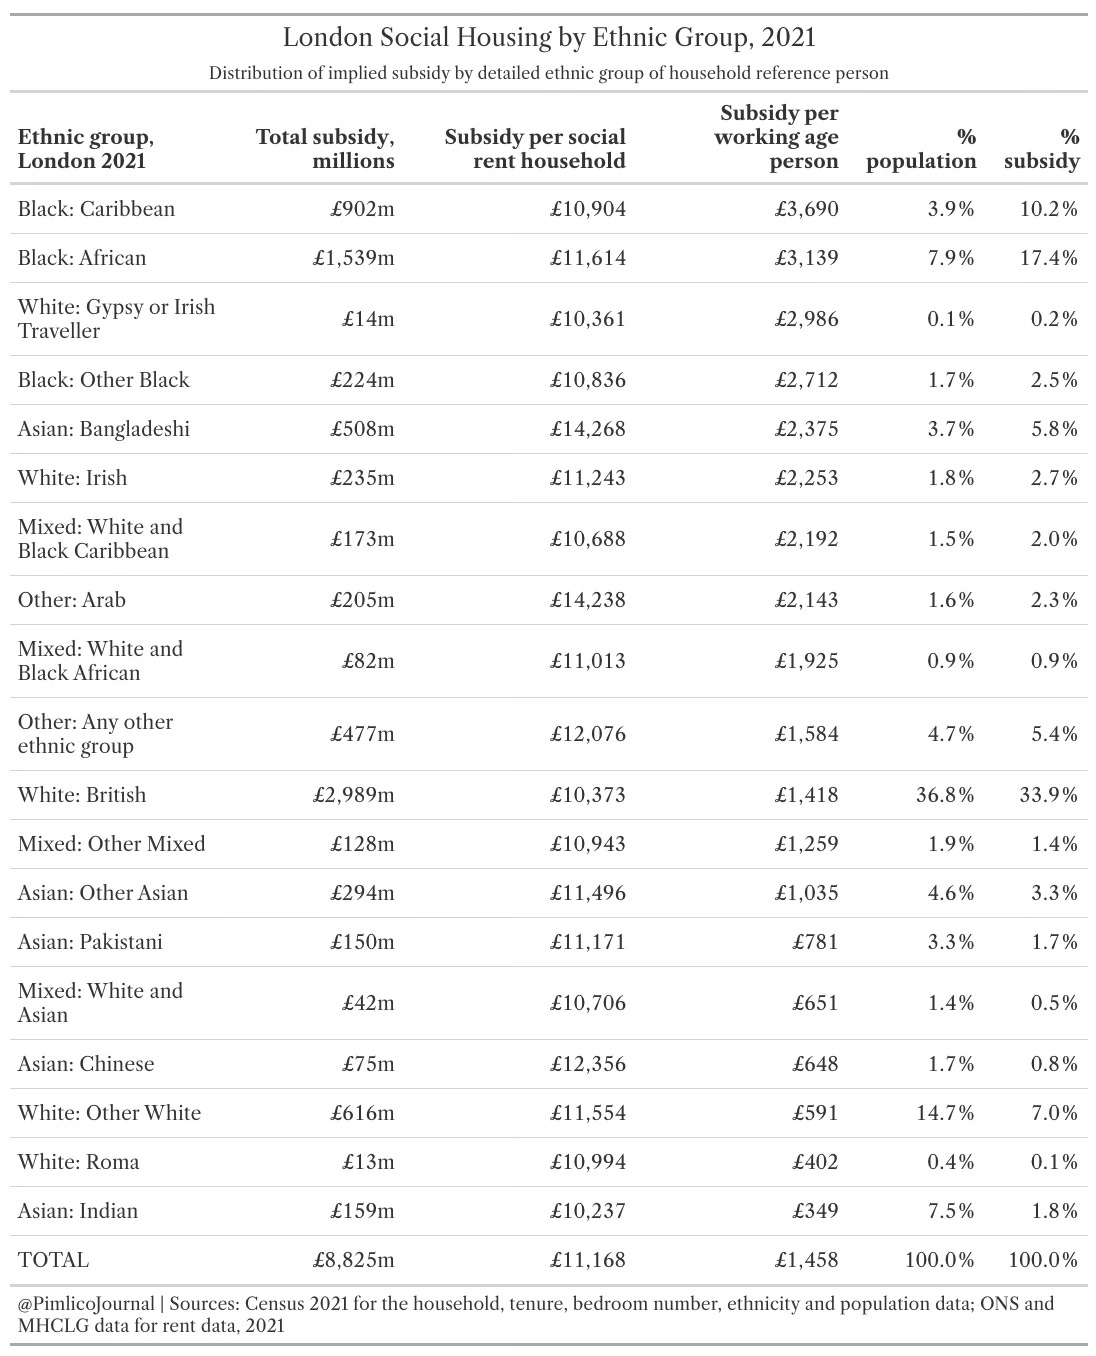
Bangladeshi social housing gains are also pronounced, and are a break from the England-wide picture, where Asians gain less than average from social housing. In East London especially, Bangladeshis arrived in large numbers from the late ’60s and ’70s, and were able to take advantage of changing housing policy — pioneered in the capital — to gain a substantial foothold in social housing. The consequence is that, as a group, they account for 3.7% of London’s population, but gain 5.8% of its subsidies — meaning they are not only heavy users of social housing in the capital, but expensively so, with the mean Bangladeshi social rent household gaining a very large £14,268 in implied subsidies in 2021, partly reflecting the fact that they are over-represented in larger social homes. Overall, Bangladeshi-headed households in London gain an estimated £508 million every year in implied rental subsidies, with half of this in just one borough, Tower Hamlets.
Economic inactivity and unemployment
A central reason for focusing on the allocation of social housing is that housing is scarce, and this is especially the case in London, which also has the richest job opportunities available in Britain. In this setting, one of the most pressing questions is whether social housing is accessible to people who are able to contribute to London’s economy, or is instead being allocated for entirely different reasons.
That’s a big question, but it has become clear that the allocation is driven by all manner of ‘needs’ and entitlements, and not all by the supply of skilled workers for the industries which drive London’s economy. There are lots of aspects to this, but the easiest and least controversial way to break down how much social housing simply isn’t geared towards the economy is to look at the amount of London’s social homes which are occupied by households headed by the economically inactive and unemployed. (Remember that this approach still says nothing at all about those who are only marginally employed.)
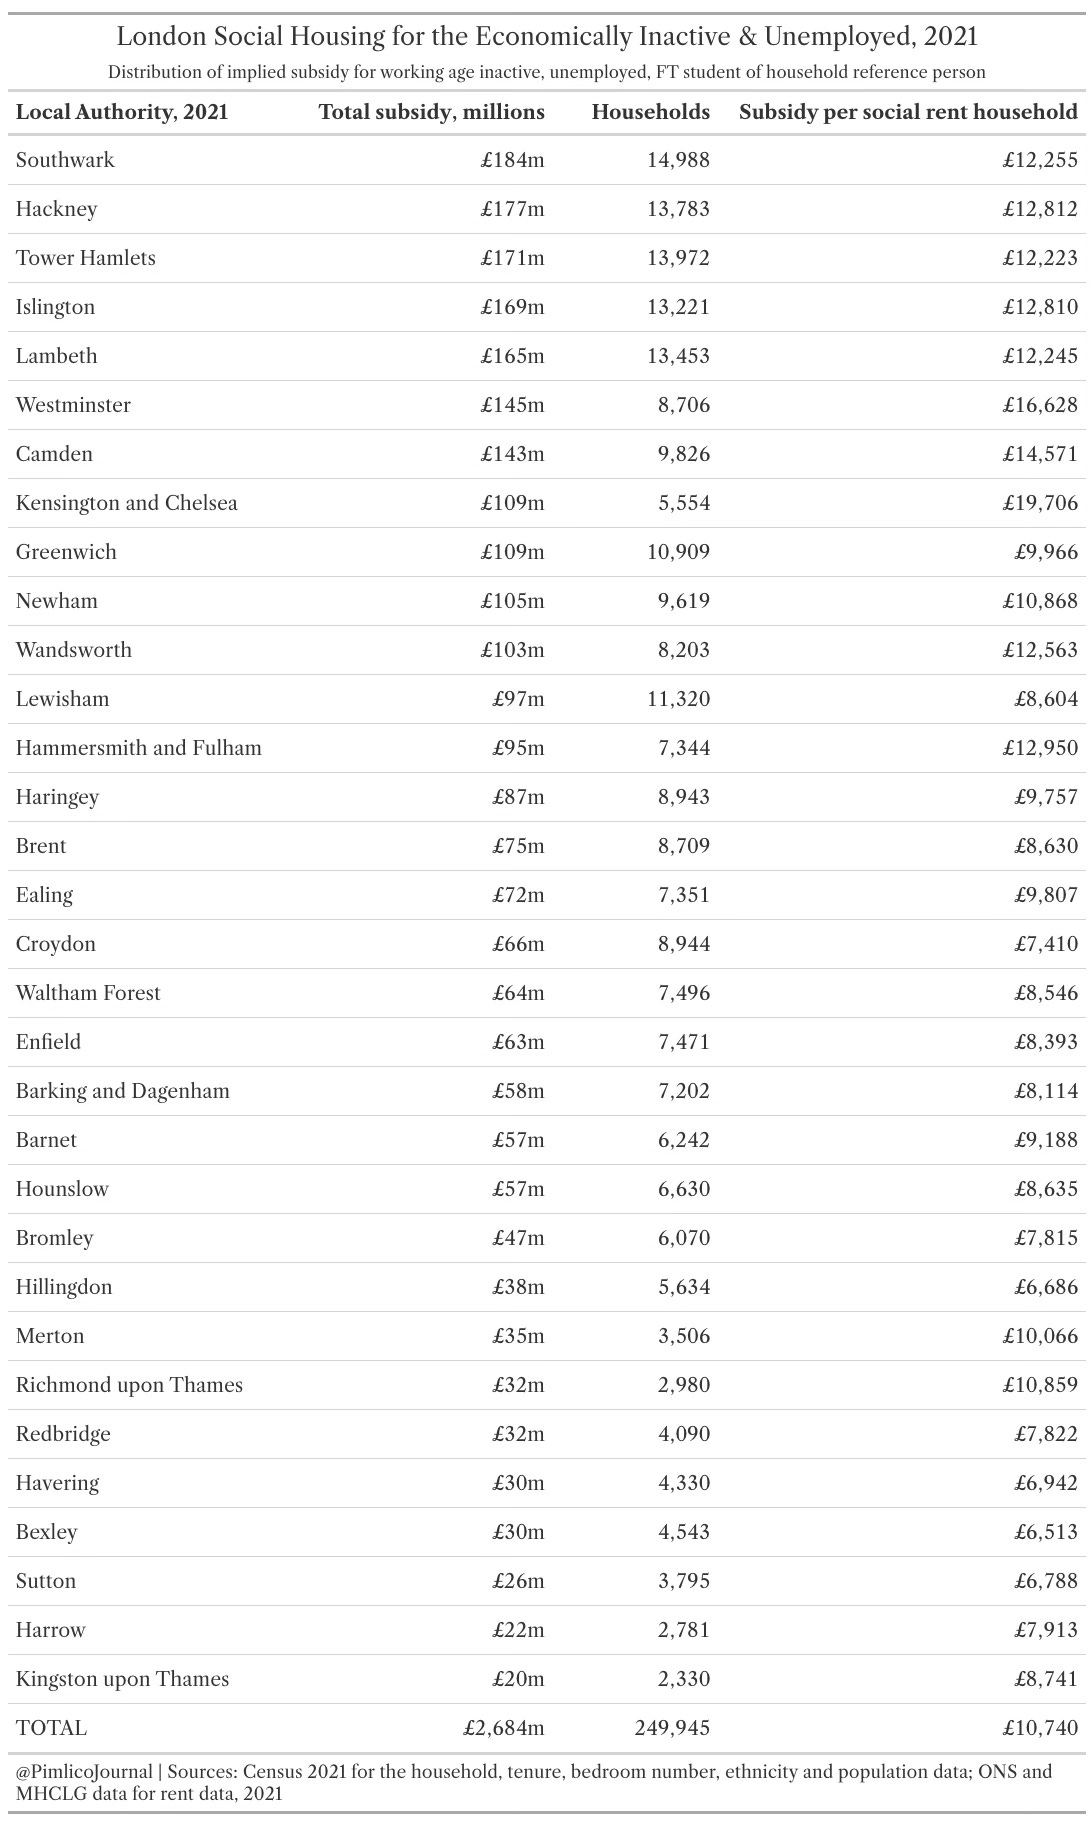
Some social housing is taken up by the retired, so we will exclude households headed by somebody over retirement age. Instead, we look at those households headed by somebody of working age but either economically inactive or unemployed, or a full-time student (as it isn’t clear why we would provide selected students with the kinds of large implicit subsidies of London social homes, while all other students are expected to either live with their parents or to pay for private student accommodation).
The table below breaks down the allocation of social housing to these households for each London borough. Across the capital, £2.7 billion in implied rent in 2021 was given in subsidy to these households, with the relatively small number in Kensington and Chelsea gaining an estimated £19,706 in subsidy per social rent household, the largest amount. On average, social rent households led by working age people not in work gained £10,740 in 2021 — that’s nearly £1,000 every calendar month in additional, unmeasured benefits.
What is to be done?
Social housing was a nineteenth-century invention to tackle problems of material poverty and squalor. It is far from clear that in an age of an expansive regulatory bureaucracy and information tools to share rent information and reviews it remains a helpful way to ensure good standards of housing. News stories have for decades routinely exposed that social housing providers are often not good landlords, and equally that social tenants are not model tenants. The high levels of social housing provision in Britain have not avoided the need for large housing subsidies — by far the largest as a percentage of GDP of the OECD countries listed here, despite our relatively large social housing stock by international standards — through the benefits system either, and so it is time we considered whether social housing is actually a central part of our housing problem in Britain, and not the solution.
The politics of social housing in Britain are particularly difficult because, as briefly mentioned above, many middle-aged and older voters have outdated ideas, often from their own upbringing, about what social housing looks like. For those raised in the postwar decades, especially the ’50s, ’60s and ’70s, social housing was often associated with working class respectability and sometimes aspiration.
But the radical shift in social policy at the end of that period means that social housing is no longer anything like the rose-tinted memories of Boomers and Britpoppers. Social housing is now allocated on the basis of a political and bureaucratic understanding of ‘need’ and entitlement, with all manner of consequences for the experience of living in — and, just as importantly, around — social housing that this brings.
The evidence here and in the original ‘Social Housing Phenomenon’ article is that the social housing sector has been used to enable mass immigration into Britain with easy access to subsidised homes for new arrivals and their descendants. Most important still, this access has been easiest in London, where homes are most valuable for tenants just as they are to the wider economy. If Britain struggles to build homes where they are needed, it also seems intent on allocating its most valuable homes on anything other than economic grounds.
Social homes represent substantial assets to their tenants. As demonstrated in this article, a typical Kensington and Chelsea social home is worth nearly £24,000 a year in implied rental subsidies to its tenants. Given that London’s housing market has an estimated yield of 4.4%, tenure in this home is an asset worth over £500,000 to its tenant. Social housing tenancies are secure by design, and in fact, bizarrely, resident relatives can inherit a tenancy (‘succession’), which over time helps to consolidate some of the ethnic concentrations in social housing residence briefly explored above. For their tenants, social homes in London are a veritable goldmine; one that has not been earned, but also one to which they can become chained, as they’re not something which can be sold, either.
By far the worst solution to the resources lost on social housing would be any expansion or evolution of Right to Buy, as some have foolishly proposed. Regardless of whether that was a good policy in the ’80s, the way that social housing allocations have become driven by ideological conceptions of ‘need’ means that it would effectively be endowing large numbers of foreign nationals (as well as recently naturalised citizens) with large sums of movable capital, at the expense of British people who have been here for generations and often taken little from the public purse.
At the same time, we should be clear that endless ‘YIMBY’ demands to ‘build more bloody houses’; for Street Votes, Gentle Density, and Mansard Extensions are all a sign of abject cowardice when social housing is right there. Despite recent claims of ‘victory’ (with no real evidence provided), the government remains committed to the fundamentals of the political planning of housebuilding. In that context, the sheer scale of the backlog, the pressing need to build more in and around the capital, the continuing very high rate of immigration, and the exaggerated, but real economic and physical constraints in rapidly scaling up housebuilding all suggest that any real progress in closing the gap through YIMBYism alone remains as far away as ever.
Meanwhile, social housing sits there, just waiting to be brought into the market. If the social housing portfolio were exposed to the gales of creative destruction, then it would gradually result in a substantial rationalisation of the housing market, allowing the pressures built up over decades of failed housing policy — the costs of which have been imposed on ordinary taxpayers — to finally take effect. That might mean a rapid turnover of tenants in favour of those able to earn salaries in central London to pay a higher rent. Or, it may mean turning over whole social housing sites to allow for new construction of denser, but more attractive homes.
Although the 2021 Census data didn’t allow us to make this distinction, using the data on the stock of housing for 2024, we can focus only on the ‘general needs’ stock, and ignore the quarter of social homes built specifically for the disabled and elderly. We can also look not only at the subsidy, but at the total rental value of that stock.
Accounting for location and property size and using median rents in 2024, England’s general needs social housing stock was worth £36.8 billion in market rent; of this, £13.2 billion is in London alone, and £8.7 billion is in Central London. We can accept that this is probably an overestimate given that individual locations may be less desirable, tenants may not always be ideal, and that there may be a backlog of problems in the estate: so let’s knock some discount off, and use rental yields to value it.
We can provide some validation for this approach by looking at just one borough and comparing the council’s own valuations. If we take the same approach in Kensington and Chelsea for only local authority housing, we find 6,440 homes with estimated market rent value of £203 million. Applying our valuation model and using a 25% discount to account for the downsides of social housing and a 4.4% rental yield, this becomes £3.4 billion, or £531,250 per home.
In line with public sector accounting conventions under the Local Government Transparency Code 2015, the Royal Borough and Kensington and Chelsea helpfully publishes its own valuations. Their view is that their current usage values the local authority’s 6,687 homes (so a slight difference in data) at £803,498,432 (at an average value £120,158, using EUV-SH, or ‘existing use value-social housing’). At market values, on the basis of instead renting them out at market rates, Kensington and Chelsea would see their social housing stock as being worth £3,215,411,000, or £480,845 per home (using MV-ST, ‘market value subject to tenancy’). Lambeth’s figures suggest similar results, with — if anything — our own model being too cautious, estimating an average value of £365,000, whereas Lambeth’s value is £411,013. But overall, not too far off. Let’s tweak our model a little, erring even more on the side of caution, making the discount factor 35% for London, and making it more cautious still outside of London (given the lower pressure in these markets), with 50% discount and a higher expected rental yield (5.5%).
On that basis, social housing in London is worth a potential £210 billion, and the rest of England around £215 billion. Rationalising London social housing has the highest promise, so it may be better to focus the plan only there, especially given the politics involved in achieving this for any future right-wing government — but then again, in an ideal world, it may be better to just get the British state out of the landlord business entirely.
These are enormous potential asset sales, enough to finance a substantial reshaping of the British state over a number of years, as investment vehicles are created to take ownership of social homes and then equity is sold to private sector investors. They would doubtless require major changes in social policy to move from a position where so many people live at vastly subsidised rents — but that’s an opportunity to be welcomed, removing deep unfairnesses where some people gain by getting a social home, while others are left to get by. The largest prize, though, is the economic gain of moving these homes into the private sector, so that investors can better adapt our built landscape to market demand.
This article was written by Thdhmo, a regular Pimlico Journal contributor, with assistance from JUICE, Nigel Forrester, and two anonymous contributors. Have a pitch? Send it to pimlicojournal@substack.com.
If you enjoyed this article, please consider subscribing. If you are already subscribed, why not upgrade to a paid subscription?
Great as always.
Fascinating read. Thank you!