The Social Housing Phenomenon
What John Burn-Murdoch isn't telling you about immigration
Social housing has become one of the hottest topics as of late on x.com. While we would have liked to have had John Burn-Murdoch, senior fellow at the London School of Economics, award-winning columnist, and chief data reporter for the Financial Times, to tell you who gets a free house in Britain, his lack of interest in doing so has left it incumbent on us at Pimlico Journal to do so. John has still not responded to any of our numerous requests for comment; perhaps he is busy. (I have been told that the new BA.2.86 COVID variant is on the rise.) But how can anyone know what to think about the pressing issues of the day without first digging into The Data?
We will attempt to do just that: to give our readers all of the key facts and figures – The Data – pertaining to social housing in a single piece. We will mainly be examining social housing in London, as this is what typically attracts the most attention, but, where possible, we will examine national trends as well.
A Very Brief History of Social Housing in Britain
The origins of social housing1 in Britain can be found in the Liberal reformism of the early twentieth century. Social housing as a form of tenure grew rapidly in the decades following the First World War, and what was little more than a rounding error in 1914 would reach a fifth of all tenures in 1951. This change was principally spurred on by the passage of the Addison Act of 1919. The direction of post-war housing policy – in particular, its emphasis upon slum clearance and the consequent decline of private slum landlords due to the construction of new, socially rented council estates – would lead to further growth, and social housing would come within striking distance of a third of all tenures in 1981.


However, from 1981, numbers would fall, principally as a consequence of the Thatcher government’s Right to Buy scheme, as established by the Housing Act 1980; moreover, in this period there was also a collapse in the number of social housing dwellings being built.
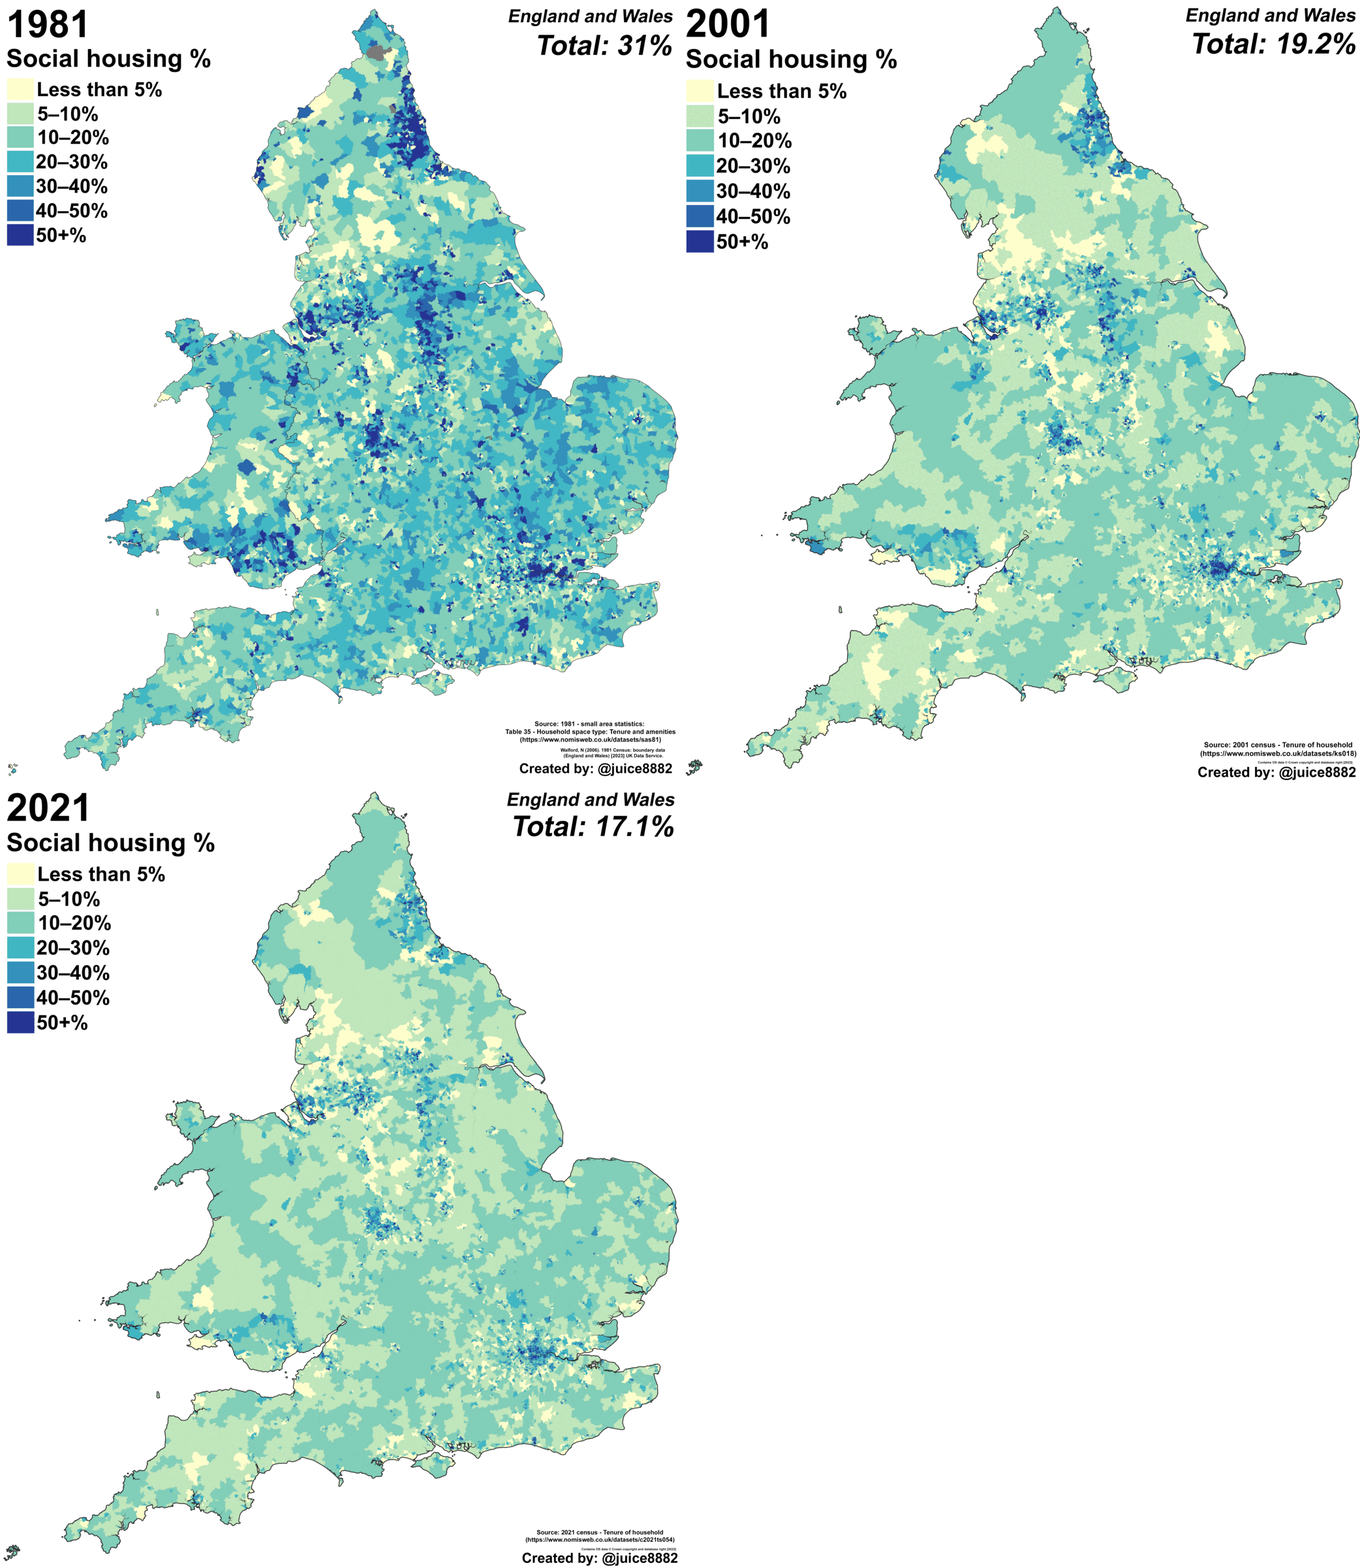
Nationally, increased homeownership has led to the virtual disappearance of social housing in many areas in which it previously dominated the housing stock. Figure 4 shows this decline nationally by ward, for 1981;2 and then by MSOA (Middle Layer Super Output Area) for the 2001 and 2021 censuses:
I have gathered data on a range of different characteristics of the current occupants of social housing in England and Wales.3 Take a look for yourself:


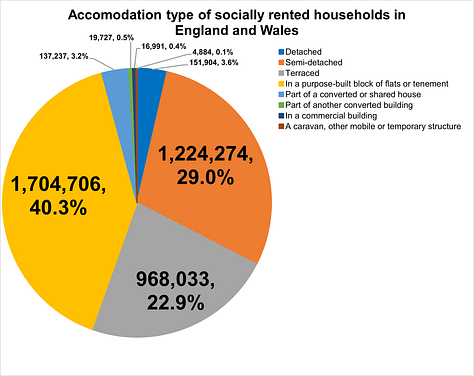
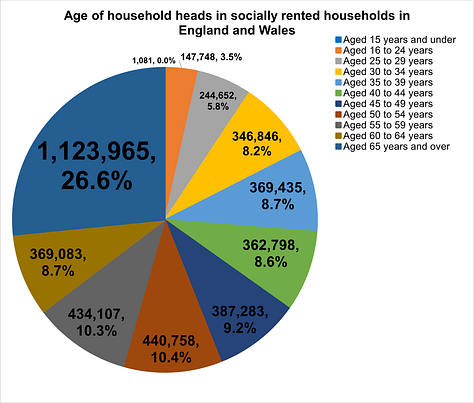


If we were to briefly summarise the mass of data above, we can see:
That social housing occupants are relatively evenly spread across the country, though the greatest numbers are in London;
That over a third of occupants have no qualifications (though this is partly ascribable to the older age profile of social housing tenants);
That most of those who do work are in menial, low-skill occupations;
That around two-fifths live in flats or tenements, while around a third live in detached or semi-detached houses;
That lone-parent households and one-person households (non-elderly) make up an even share of the occupants of social housing;
And that ethnically, the occupants seem to mostly correspond to national demographics, although there is significant overrepresentation of black households in the national data.
Moving away from the national picture, London represents the most striking local case study of social housing in Britain. Roughly a third of London households lived in social housing in 1981, but over the last four decades, numbers have declined substantially:
An interesting feature of social housing in London is that it is primarily located in the inner city. In most European cities – to give but one example, Paris – the inner city is where the most expensive and desirable housing stock can be found, and this (for the most part) is also the case in London. In London, however, we do not shunt people who cannot make rent out to the banlieues. Instead, we place them in our most desired neighbourhoods at discount rates. Giving free accommodation to people with few qualifications, who are employed in menial occupations, in areas otherwise known for their economic prosperity, is a bizarre policy, and it is only appropriate that we pay it special attention.
Who occupies the current stock of social housing?
The data allows us to look at the occupancy of social housing in two main ways. Firstly, by the country of birth of the household head; and, secondly, by the ethnicity of the household head. Let’s start with the former to give us an idea of the foreign-born occupation.
Country of birth
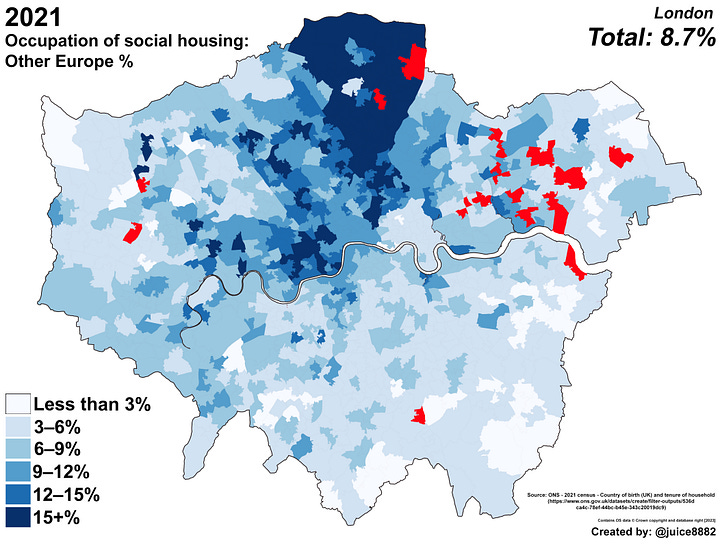
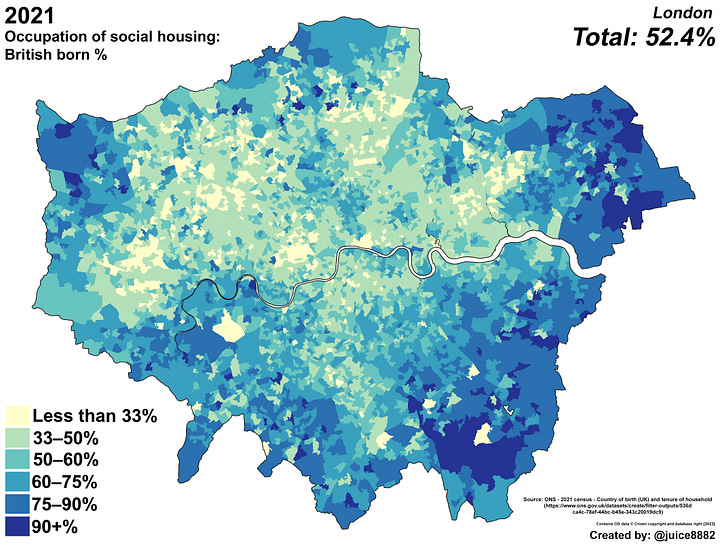
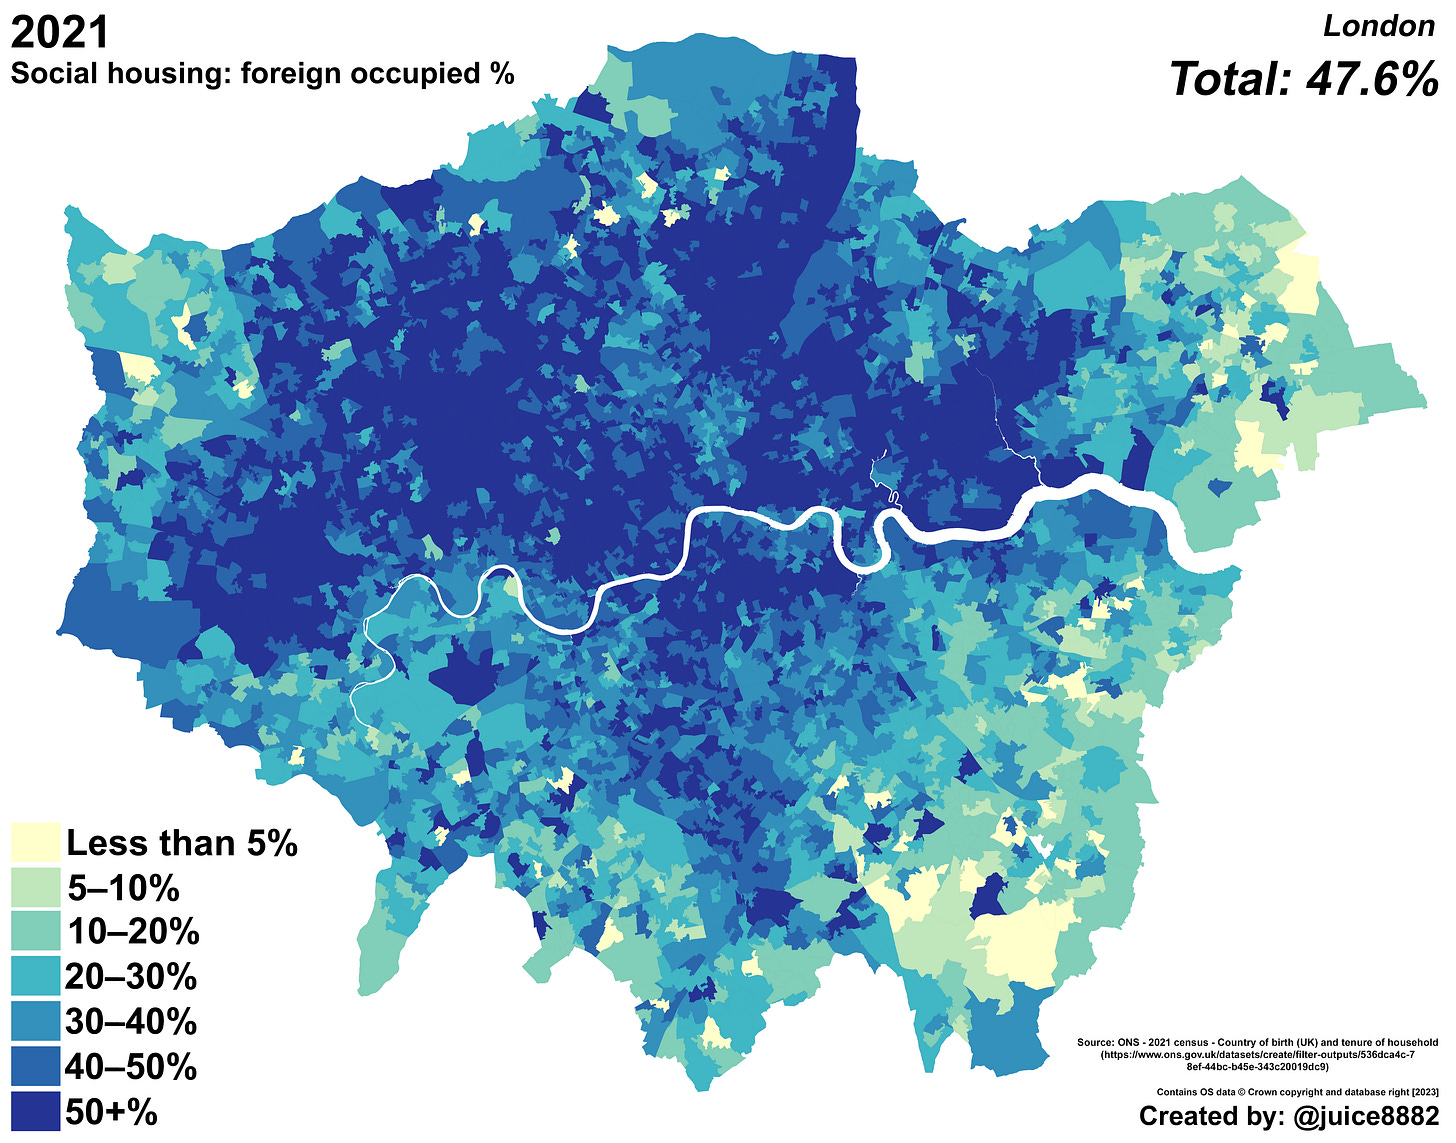
As migration has soared since the late ’90s, so too has the occupation of social housing by foreign-born household heads. In England and Wales nationally, 19.2% of the occupied social housing is taken up by a foreign-born household head. This rises and falls depending upon the locality, and for the most part the higher percentages are concentrated within our urban sprawls.
In our capital, nearly half – 47.6% – of the social housing stock is headed by a foreign-born household head. In some boroughs, such as Brent and Newham, this percentage rises to that of a super-majority.
This foreign occupation should not in itself come as much of a surprise, though, given London’s large foreign-born population: 40.6% of all household heads in London are foreign-born. It is only by specifically analysing the continental origin of household heads that we can begin to see that African-born household heads are significantly over-representated, occupying 6.2% of even the national social housing stock.

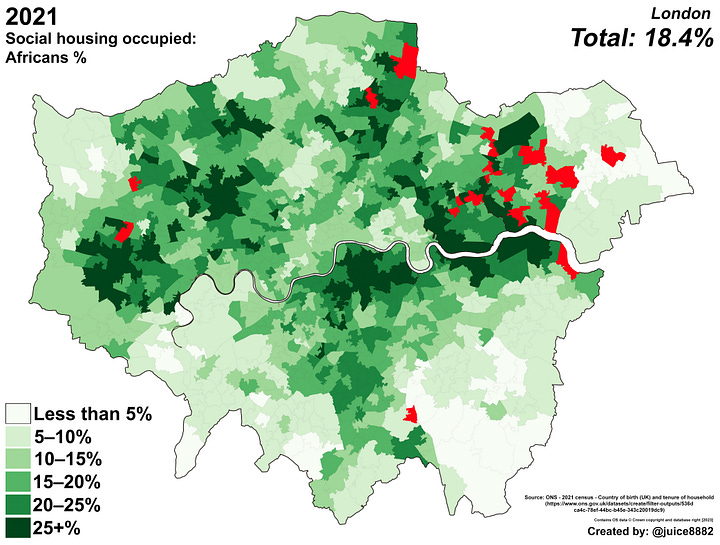
The overrepresentation of African-born household heads in social housing is in fact a recurring feature of all major urban areas, but is most prominent in London, where they occupy 18.4% of the total stock. They also, however, occupy 11.5% of Birmingham’s stock, and 14.3% of Manchester’s.
Generally speaking, country of birth groupings are concentrated in particular areas, and their localised occupancy rates of social housing tend to reflect this. See, for example, the very high percentage of Asian-born social housing occupants in Tower Hamlets, compared to the low percentage in South London:

Year of arrival
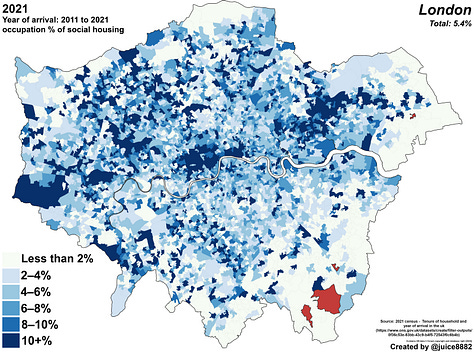
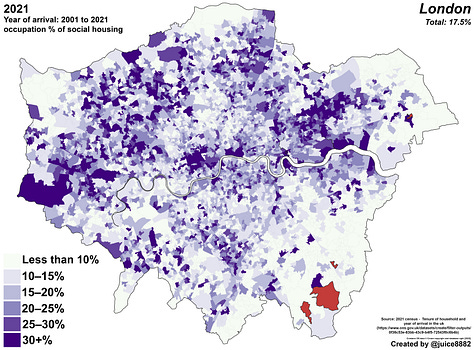
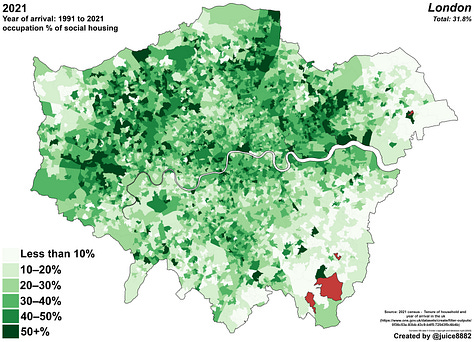
The census also allows us to look at social housing occupation in terms of a foreign-born person’s year of arrival. We can see that 13.9% of the nationwide social housing stock is occupied by a household head who arrived between 1991 to 2021. That is to say, it is occupied by relatively recent immigrants – and not the fêted ‘Windrush generation’! – who were not present here just thirty-two years ago.
The social housing occupancy of these relatively recent arrivals rises considerably in many major urban areas, reaching 31.8% in London; 25.1% in Birmingham; 25.6% in Manchester; and 29.8% in Leicester.

Ethnicity
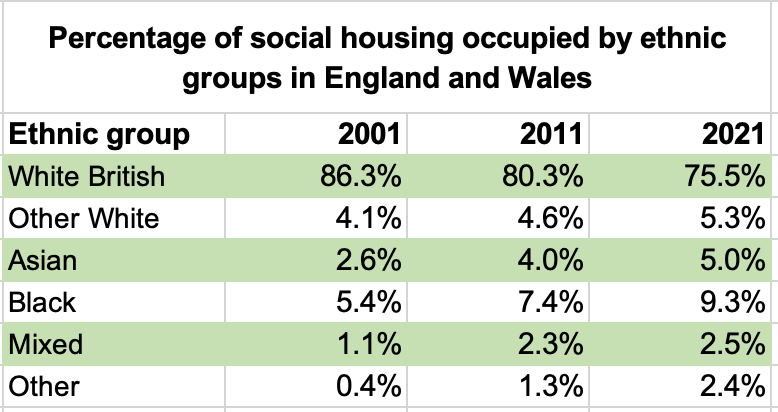
The ethnicity data allows us to really begin to get into the metaphorical ‘meat’ of this policy issue. Social housing occupation by ethnicity broadly correlates with national demographics, but as a corollary to the country of birth data above, there one major exception to this rule: both black Africans and black Carribbeans are clearly overrepresented.
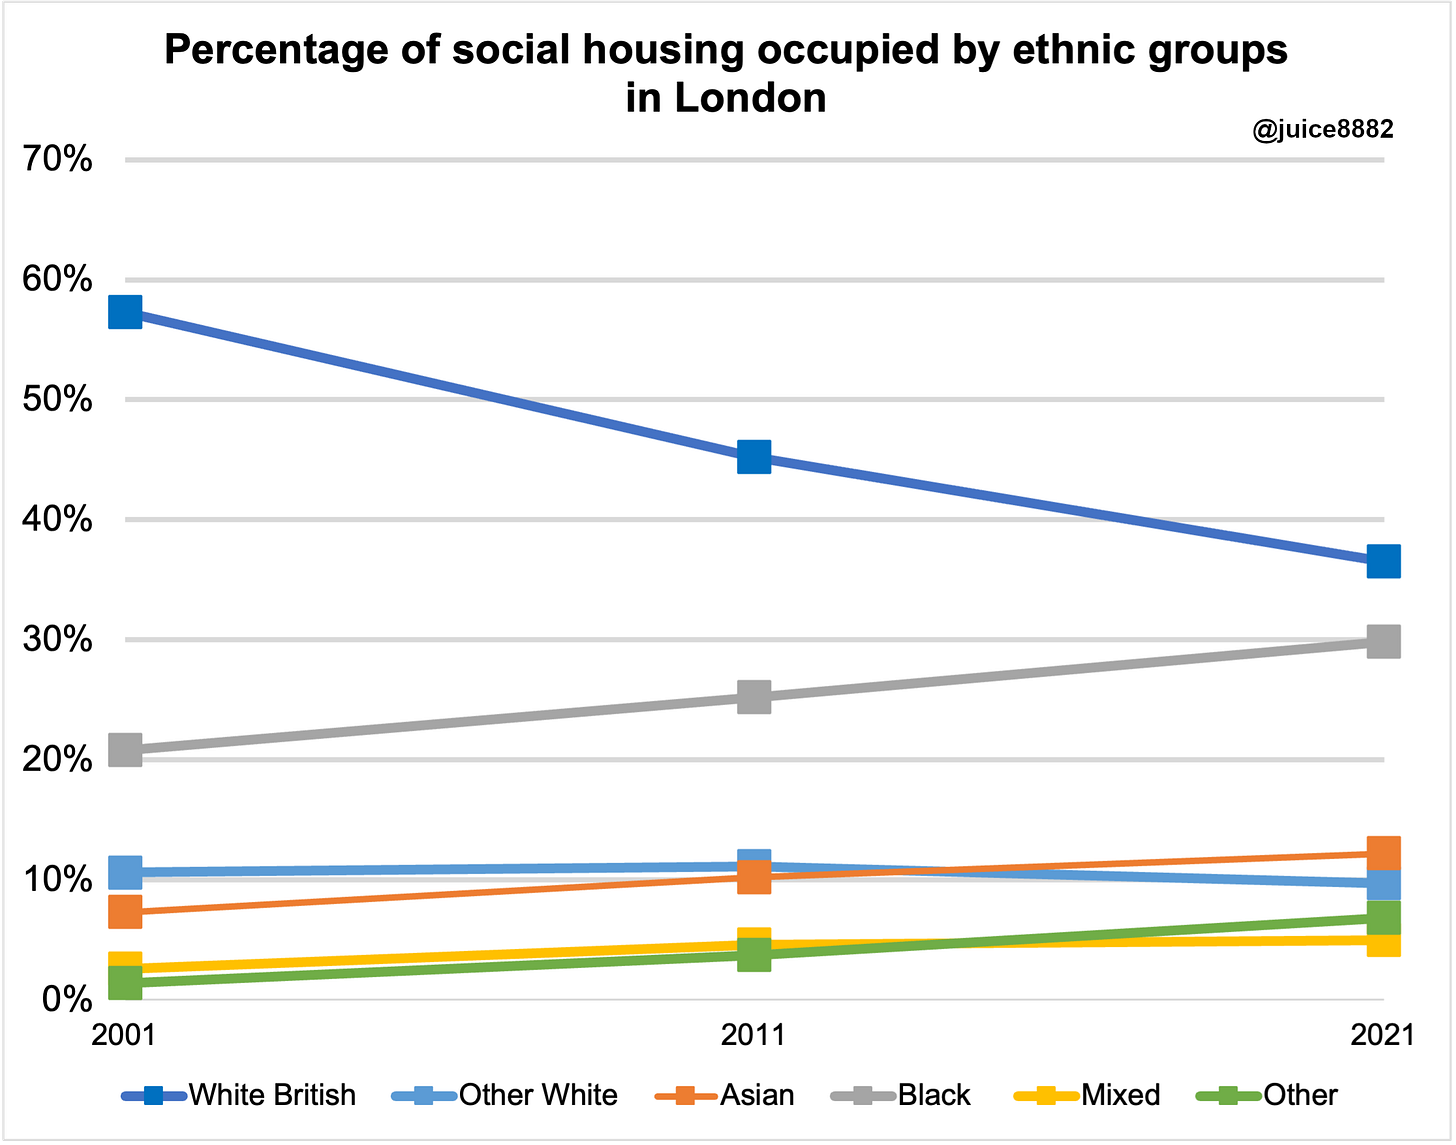
The true nature of the ‘luck’ of the ‘Free House Lottery’ really starts to show when we break this data down by geography. Blacks consistently have the best ‘luck’ when it comes to being given a free dwelling: they have a massive overrepresentation of social housing occupation compared to their proportional makeup of each area, and this has been rising in conjunction with the white British proportion’s decline. 29.8% of London’s social housing stock, 22.5% of Birmingham’s, 18.7% of Manchester’s, and 14.0% of Leicester’s is occupied by black – both UK- and foreign-born – household heads.
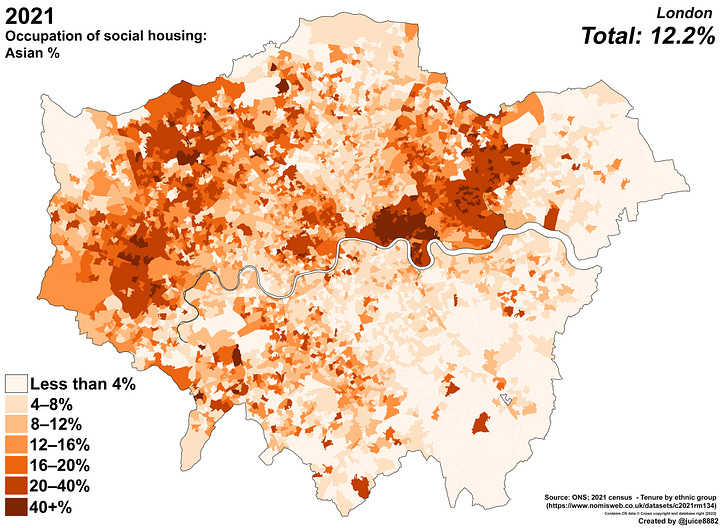
Moving back to the specific case of London, if we break the data down by ethnicity, we can see that 16.8% of the social housing stock is occupied by black Africans, and 10.5% is occupied by black Caribbeans. Only around 36.5%, the actual proportional makeup of the white British within the city, is occupied by the indigenous population. Other whites (including Irish) occupy 9.7%, and Asians 12.2%.
We now know that what would likely otherwise be prime real estate within the London Boroughs of Southwark, Lambeth, and so on, is instead used for social housing. We can now also show that this social housing is occupied in majorities or near-majorities by blacks, both African and Carribbean. White flight by the white British can explain the especially high rates of black social housing occupancy within areas where the indigenous are mostly no longer present; for instance, in Barking and Dagenham, and in Hillingdon. Asians, by contrast, have relatively low rates of occupancy of social housing in London.
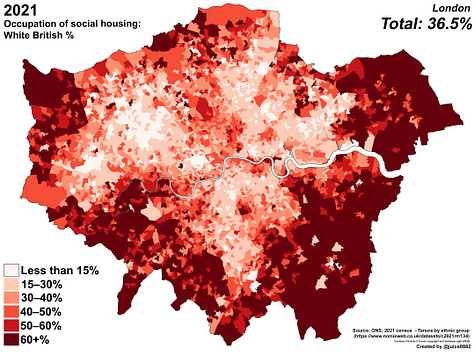
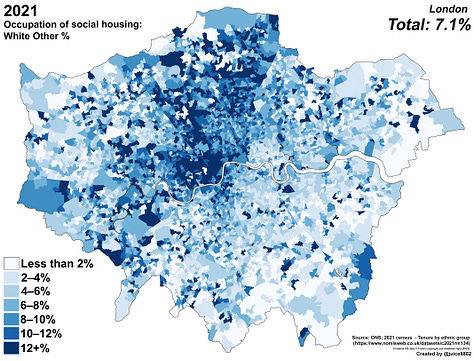
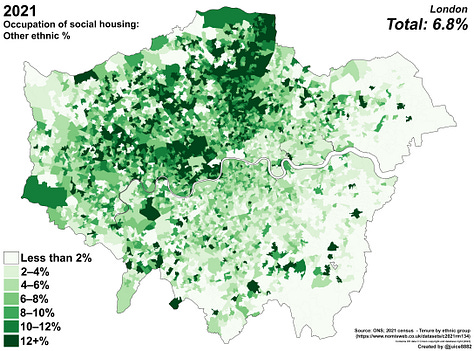
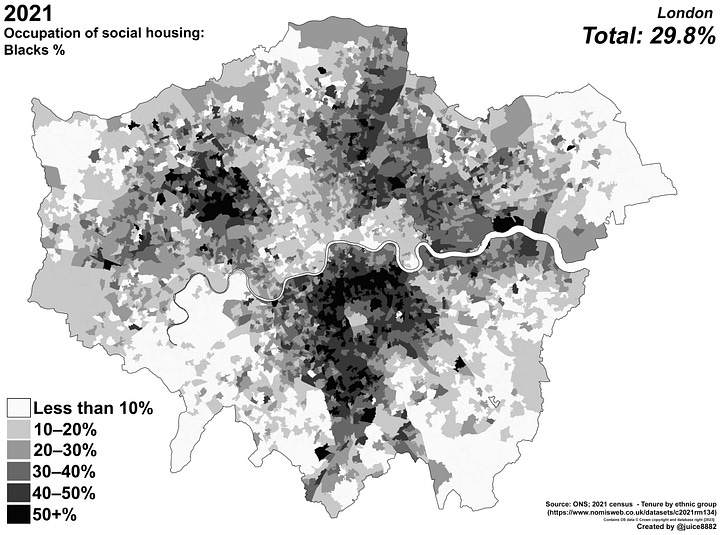
What are the rates of social housing occupancy by group?
Rates of social housing occupacy vary significantly from group to group so, for the sake of accuracy, it is important to differentiate between each group. As in the previous section, we can show these differences in a number of different ways. Let’s once again start with country of birth.
Country of Birth
African-born households have some of the highest rates of social housing occupancy. British- and Asian-born household heads, by contrast, are among the lowest.

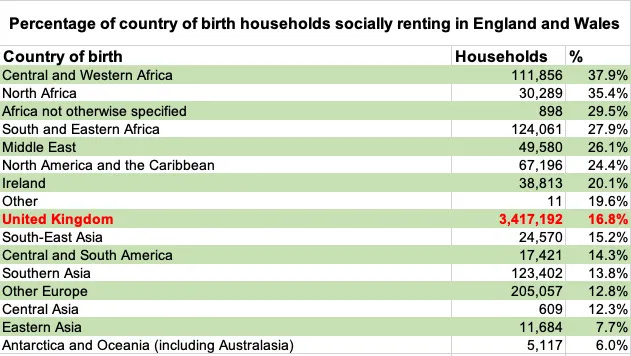
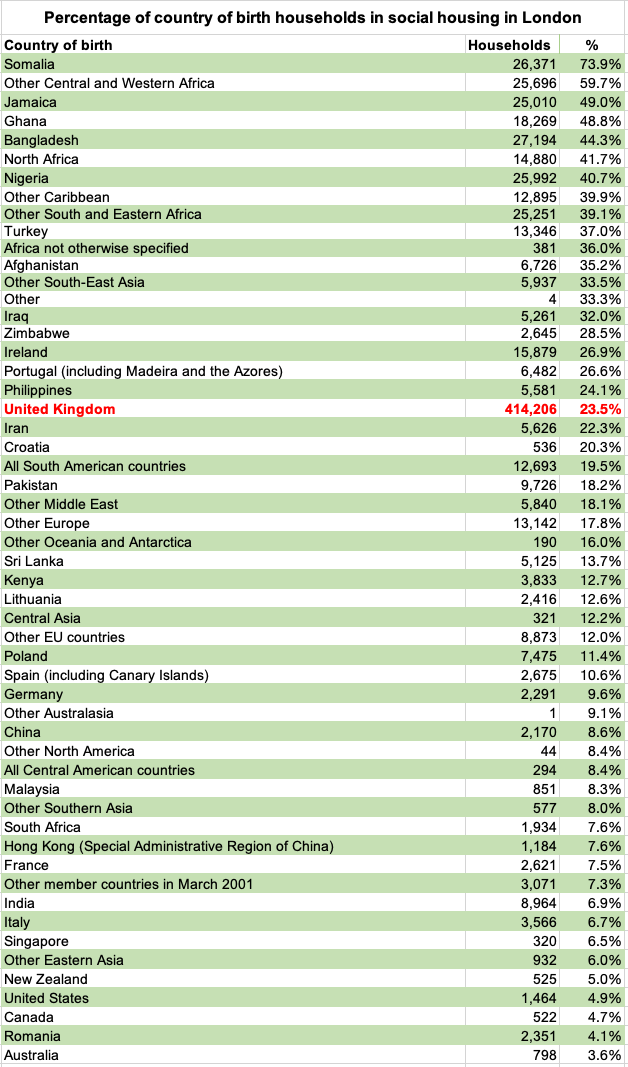
Somalis (recommended reading) in particular occupy social housing at an astronomically high rate, classic to their extremely hard-working nature: 73.9% of all Somalis in London live in social housing.

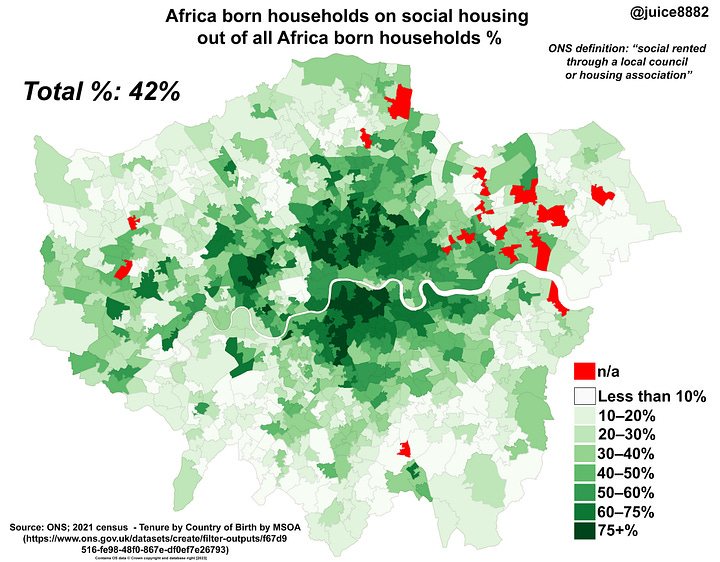
Let’s once again narrow this down even further by showing rates of social housing occupancy by ethnic group, but now by borough. The highest are African-born households in Southwark, at 74.1%, meaning that more than a supermajority of this population group live in socially rented households.
Middle Eastern and Asian households also have some high rates, especially where Bangladeshis predominate (such as in Tower Hamlets), but generally speaking, their rate is relatively low. The overall lowest group is other Europeans, with just 12.9% of their households living in social housing.

Year of arrival
The rate of social housing occupacy among foreign migrant household heads can also be broken down by their year of arrival. The highest is among migrants that arrived between 2001 to 2010, at 28.2% of these households. This may be in part caused by migrants who were in other household tenures (e.g., those privately renting) moving back home, resulting in the percentage of those who are socially housed increasing. Nonetheless, this rate is still very high for such a recent migrant group.


In London, for those that arrived in the past thirty years, this goes up to 20% overall, and is even higher in some LSOAs!
Religion
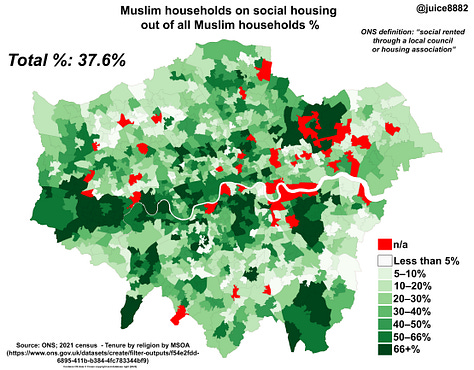
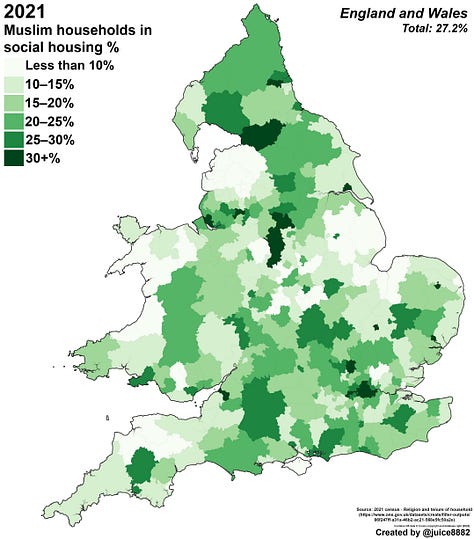
Muslim households have high rates of social housing occupancy. Nationwide, 27.2% are in social housing, while in London this rises to 37.6%.
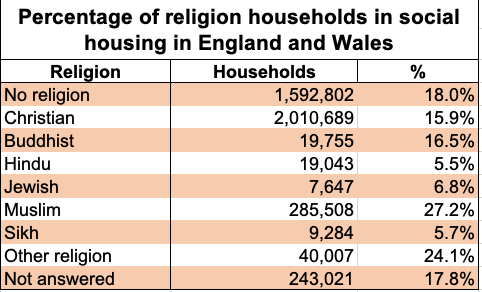

Figure 15 shows this division by local authority districts nationwide, and by boroughs and MSOAs in London. Many boroughs have the majority of their Islamic population living in social housing. Worth bearing in mind after the recent hubbub surrounding the pro-Palestine ‘protests’ in central London!

Ethnicity
We’ve left some of the most interesting data for last. Rates of social housing occupancy for each ethnic group vary significantly, even when looking at the national figures. Whites and Asians have a low rate of social housing occupancy. For some of these groups, this percentage is in the single digits, such as Indians (6.0%) and Chinese (8.4%); white British are somewhat higher, at 16.3%. Bangladeshis, by contrast, are an outlier among Asians, with relatively high rates (33.5%). Other ethnic groups and mixed groups have higher rates than whites and Asians, and black ethnic groups top the list. Every black ethnic group is at least 40% socially housed, an astonishing rate:
The Asian rate is not as high as one would expect, considering the rates of other non-white groups shown. This may be due to the relatively high economic status of Indians and Chinese. In addition, it may be that the lower percentages occupying social housing is also in part due to these groups’ tendency to have more family members in a household, and their consequent lesser need for older family members to seek private housing.
These occupancy rates over time can be examined from 2001 – when statistics cross-tabulating ethnic group of the household respondent and tenure type were first collected – to the most recent census of 2021:
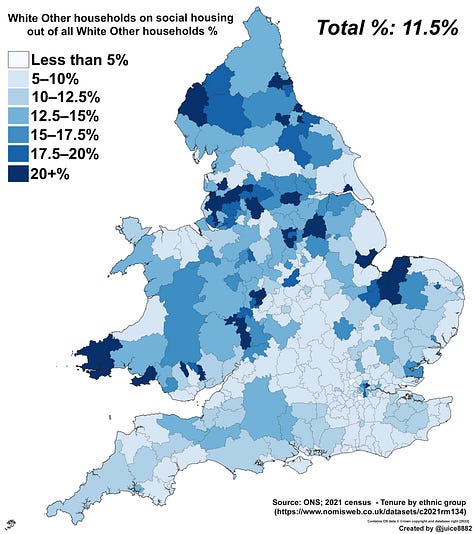
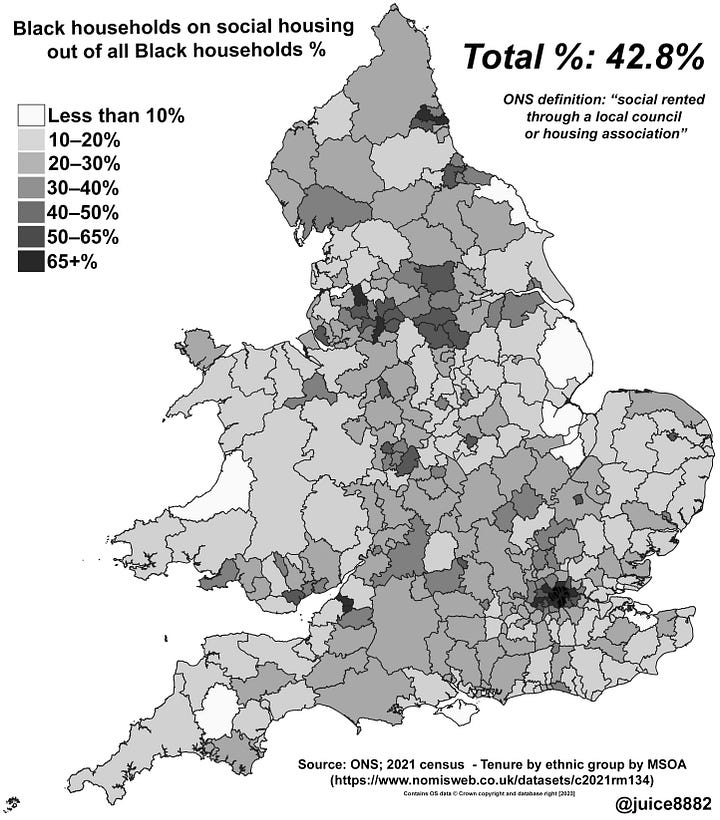
For local authority districts nationally, the below collection of data shows this for each broad ethnic group.4 Note the marked percentages in those in the North East and (especially) the inner boroughs of London, which have a much higher percentage than the national average.



Moving on from this, and back to our principal case study of London, every black ethnic group has close to half of their total population in social housing: 49.3% for black Caribbeans, 53.0% for black Africans, and 53.8% for other black. Asians once again score on the low end, with Indian and Chinese ethnic group household heads in the single digits.
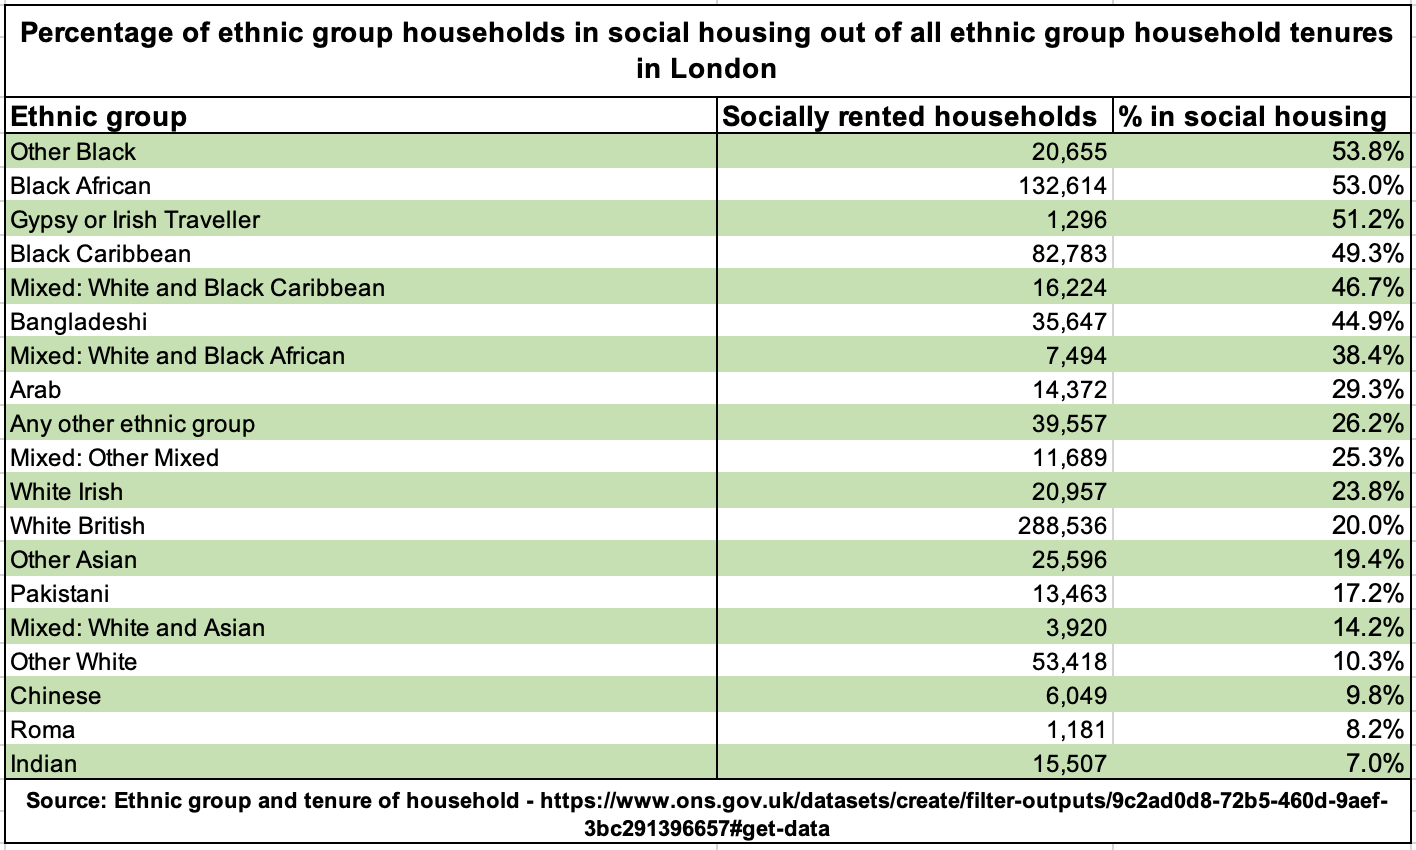
The percentage of those in social housing for each ethnic group has generally been declining; except, of course, for our consistent outlier group, the black ethnic group. In fact, even the ‘mixed’ ethnic group has seen a substantial decline in their rates of social housing occupancy, from 35% in 2011, to 30.7% in 2021. Asians, other whites, and white British households have also all seen their occupancy rates decline.
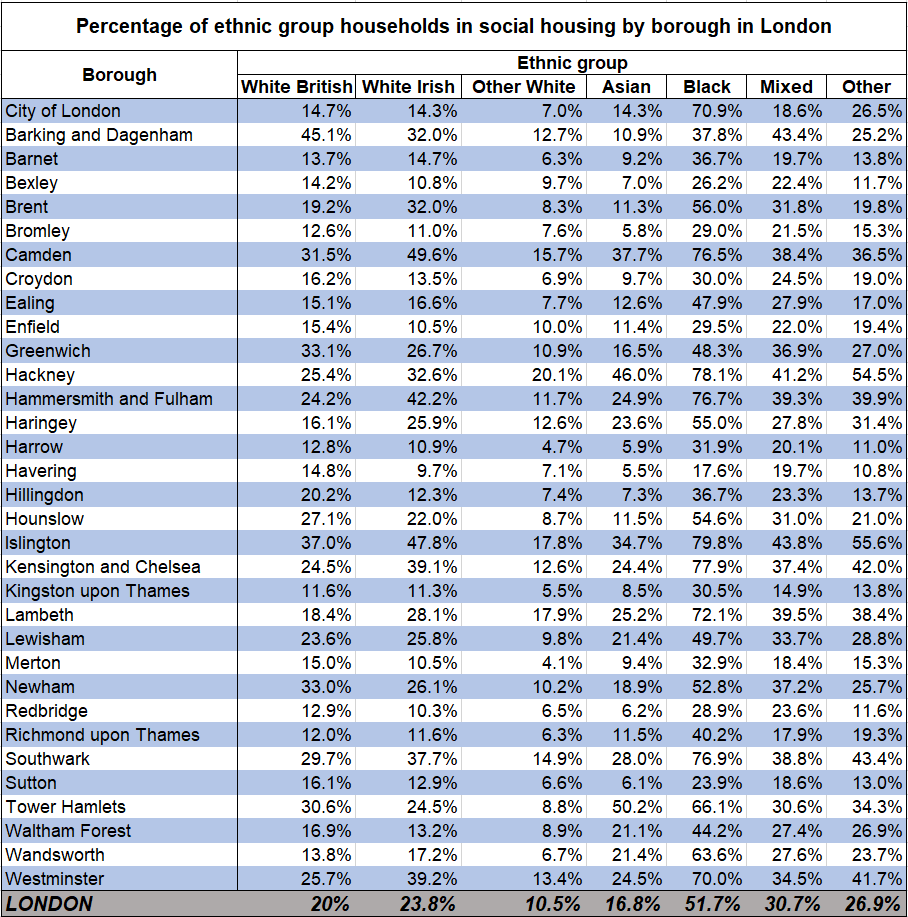
I keep highlighting the superabundance of black households in social housing. This may seem to be repetitive to some, but the figures only become more stark the more closely we interrogate the data. Truly, if anyone has won the ‘Free House Lottery’, it has been the black ethnic groups, as, alas, no other ethnic group has even close to its rate of social housing occupation. In Table 9 below, we can show this by London borough, and by the percentage of each ethnic group’s households in social housing:
This is what I would say is the most important aspect of the Social Housing Phenomenon: the subsidisation of one very specific ethnic group to exist within a highly desirable area, directly at the expense of the majority-white taxpayer.

We can therefore conclude – from the sheer fact that such high rates of occupancy have failed to dissipate over the years – that for the entire history of black migration into Britain, the public has been (for all intents and purposes) funding their housing here. No data specific enough goes back further than 2001, but we think that it is safe to assume that these percentages were a majority prior to that census, and perhaps even a super-majority in the 1981 census, which was taken before the Housing Act 1980 could have had much effect.
Figure 20 shows these rates of social housing occupancy by ethnic group within London by LSOA:
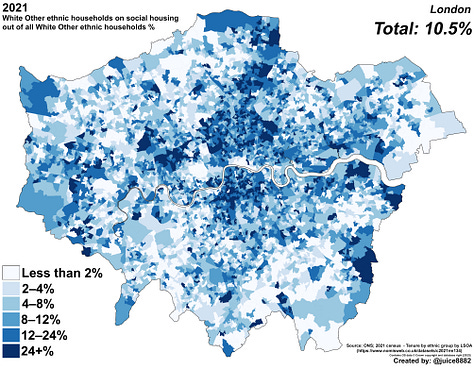
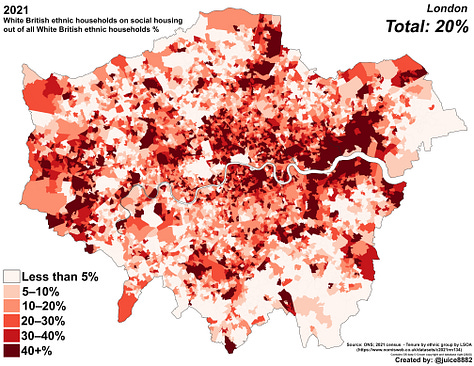
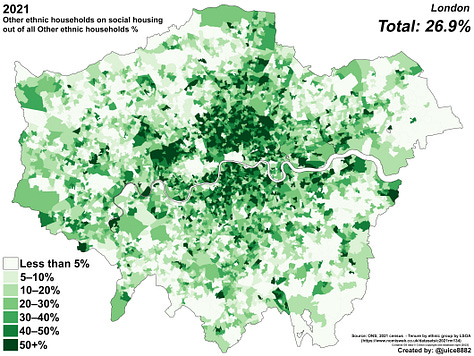
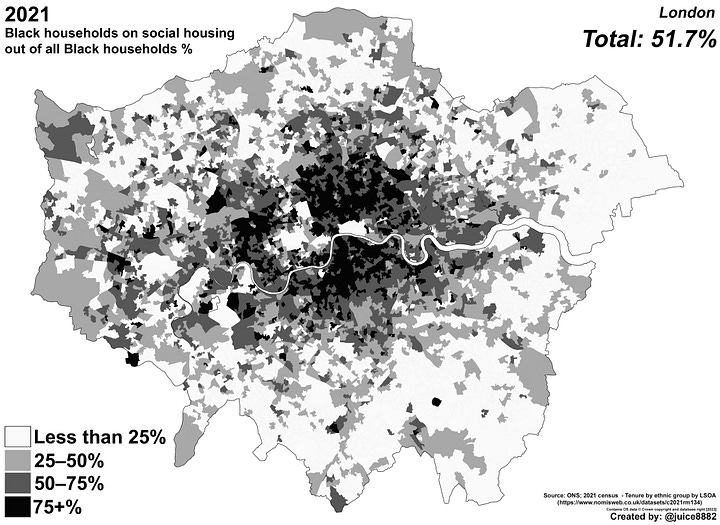
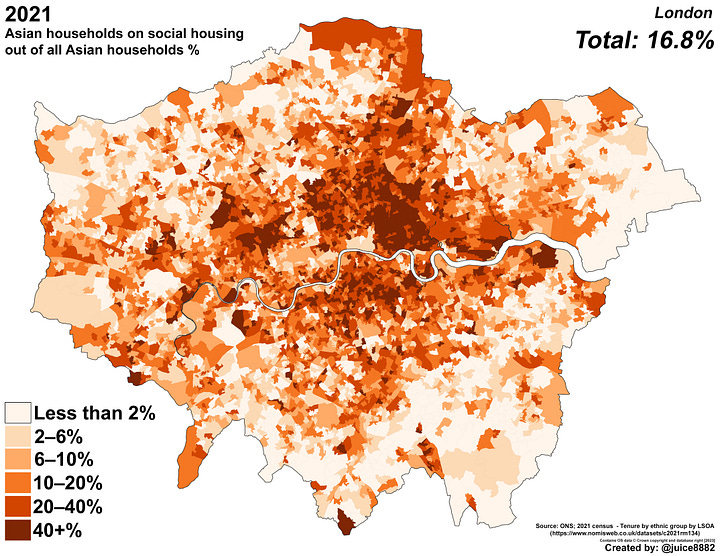
Even in our other metropolitan areas, black households have similar rates of social housing, as can be demonstrated here in a combination of data by MSOA and LSOA. 41.9% of Black households in the West Midlands county are in social housing; 46.3% in Greater Manchester; and 41.8% in West Yorkshire.
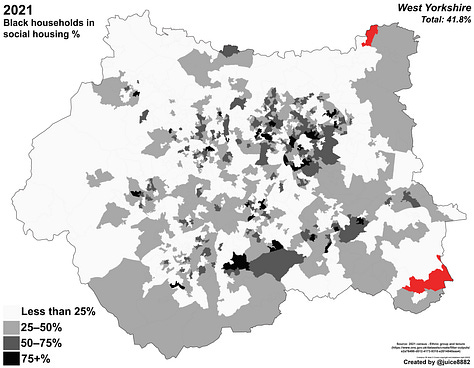
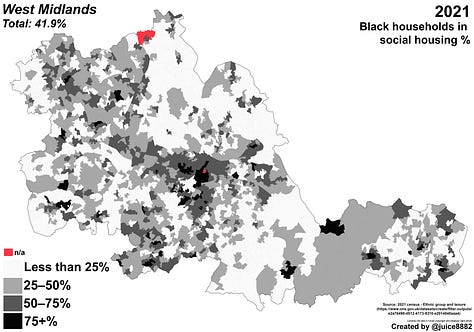
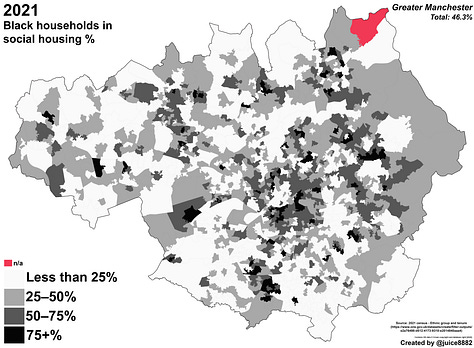


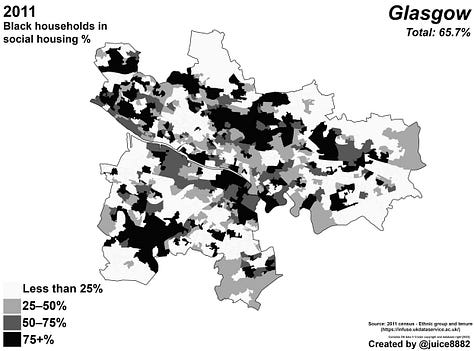
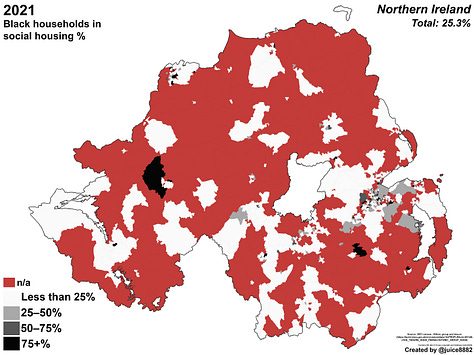
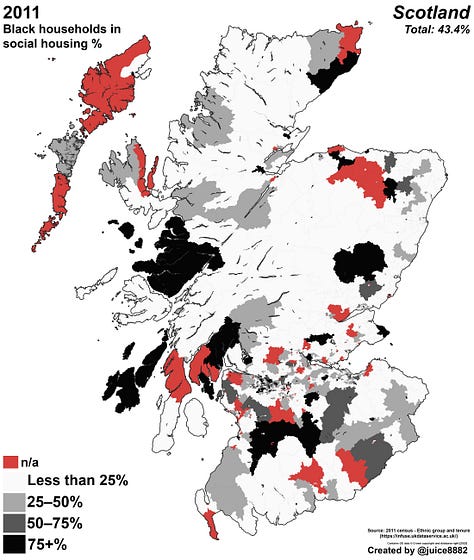
In fact, this phenomenon exists practically everywhere in this country, even in Scotland (2011 census data) and Northern Ireland (2021 census data),5 albeit to a lesser extent in the latter.


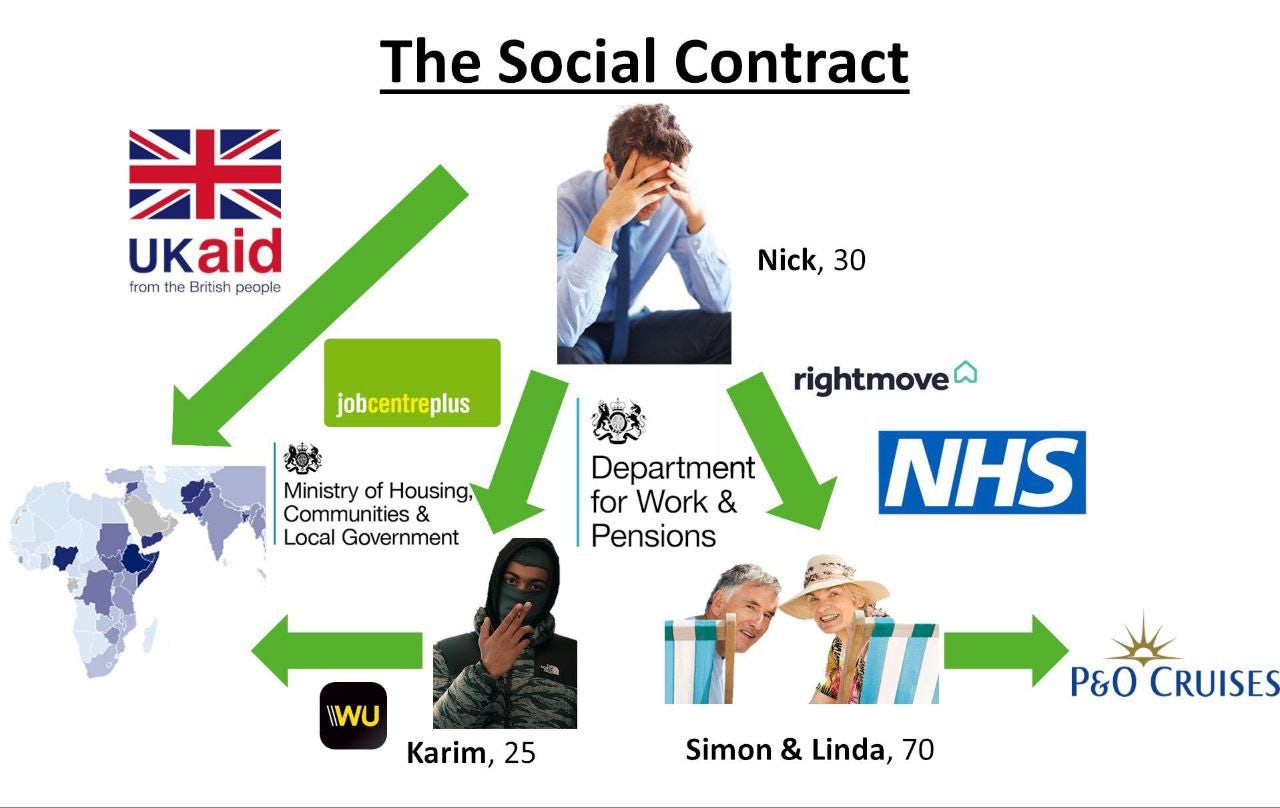
It would be nice to think that, if you work hard and pay your taxes, you can get some government services back for your efforts. It is clear, however, that what is actually funded from your labour is not an on-time train for you and ‘Walworth Gran’; but rather just a free house for ‘Walworth Gran’, who never has to get a bus to work. This is perhaps the epitome of Le contrat social™️ of London (and of wider Britain). The taxpayer is compelled to perpetually fund a system in which the ethnic groups with the highest rates of criminality in Britain are the most likely to receive free or subsidised housing that you and your family will never be able to access:
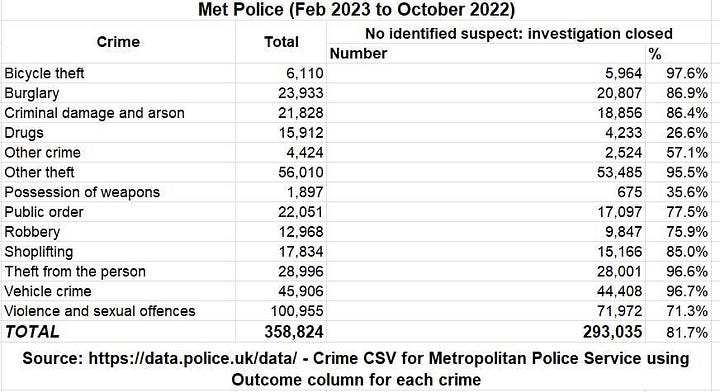

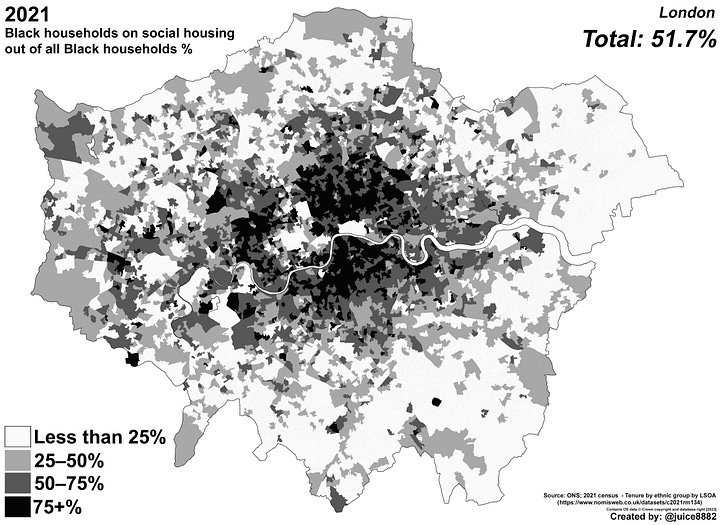
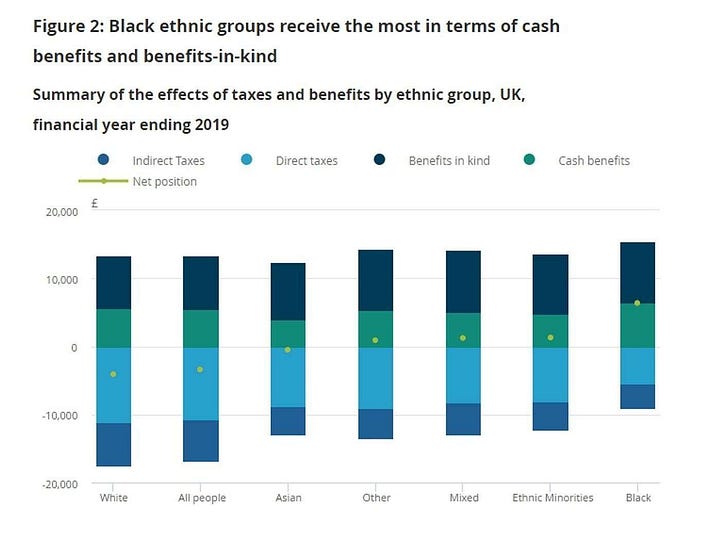
In the end, the cost of this insanity loops back round to us, the Nicholases of our society, who will be forced to pick up the bill for Boomers and ‘Our Communitehhhs’. Words cannot describe such a tragedy!
What are the rates of economic activity for those socially renting?
Let’s conclude by examining the actual amount of work the socially housed population does. The phenomenon of the ‘state subsistent’ population has increased across Britain as a whole, and there is no better place to show this than by looking at the rates of economic activity of our population within social housing.
The socially housed population group is one of the most economically inactive tenure groups as a whole. About of 43.4% of those of the ‘working age’ usual resident population that lives inside social housing is economically inactive, the vast bulk coming under ‘looking after home [sic] or family’ or ‘long-term sick or disabled’.


Comparing across tenure shows this disparity for economic activity in England and Wales, as well as in London and Birmingham. Even if we exclude students and retirees, the percentage is still astronomically high compared to the rest of the population.
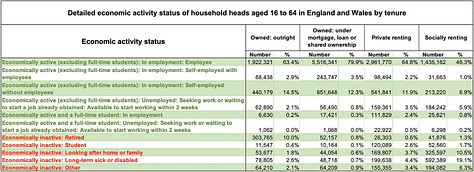
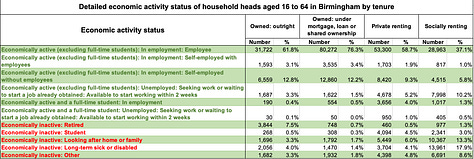

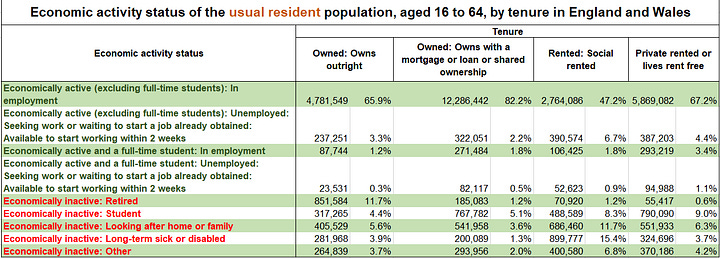

To summarize: 33.8% of social housing residents are economically inactive for reasons other than retirement or being a student; this falls to to 28.5% for London. For household heads, this is around 35.9% (for England and Wales).
We can also compare across sexes as well; see Tables 28-29 (note: I have only done this for the usual residents of households). More women usually are ‘looking after home or family’ in social housing, though there are still a number of men who do the same. The percentage for those who are off sick due to a ‘long-term illness’ is the same practically across both sexes.


While these numbers above may look not look like a lot, they do matter. If we break these numbers down by geography, we can see the rate of the ‘state-subsistent population’ – also known as the ‘milling-around population’ or the ‘sedentary masses’ – that being, those who are (a) living in social housing; (b) of prime working age; and, at the same time, is nonetheless (c) economically inactive for reasons other than retirement or being a student.

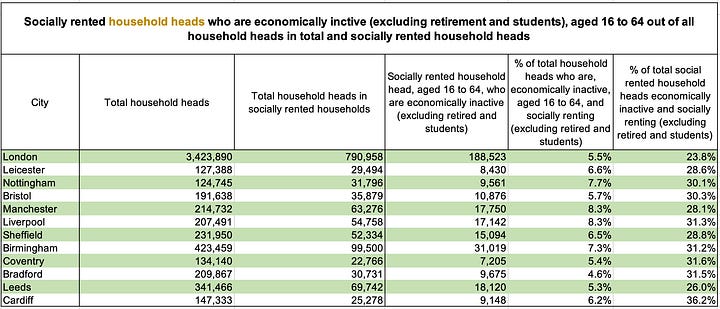
3.4% of the usual residents of socially rented households are members of this utterly useless population group. This rises in some areas – such as Inner London – to as high as 8% of the total population on our map.
Conclusion
The Social Housing Question poses a fundamental problem to our society that must be urgently addressed.
To briefly summarise, we have shown that:
20% of social housing is occupied by foreign-born household heads, rising to above 40% in certain cities. A substantial proportion is occupied by household heads who were not here twenty or thirty years ago, and the titular ethnicity occupies the minority within some of our major cities.
There is a massive discrepancy between different groups’ rates of social housing occupancy, in every aspect, including (but not limited to) ethnicity, country of birth, and religion.
A substantial number of our socially rented household heads who are of prime working age are economically inactive, and not working, even though many must be migrants who were purportedly brought here because they are ‘good for the economy’.
Urgent action must be taken to remedy the situation within our inner cities. It is not right that our most expensive areas be occupied by social housing tenants. These people are, in effect, largely paid for by the state; and even those who are working represent a major economic drain, even if many statistics may not be able to show this massive, but mostly hidden, subsidy. By selling off social housing, we could reduce crime within Inner London and help revitalise the centre of our city. Priority should be given to educated and skilled graduates, and the ‘sedentary masses’ should be moved out elsewhere.
This article was written by Pimlico Journal contributor JUICE8882. Have a pitch? Send it to pimlicojournal@substack.com.
If you enjoyed this article, please consider subscribing. If you are already subscribed, why not upgrade to a paid subscription?
You may also enjoy:
Acknowledgements
The author credits and thanks the ONS and UK Data Service for the census data and shapefiles avaliable on their respective websites. All census data and shapefiles used for this project is below and licensed freely under the Open Government License (OGL), learn more here at Licenses on the ONS website.
Sources used for graphics:
Census sources:
1981 - small area statistics: Table 35 - Household space type: Tenure and amenities
(https://www.nomisweb.co.uk/datasets/sas81)
2001 census - Tenure of household
(https://www.nomisweb.co.uk/datasets/ks018)
2021 census - Tenure of household
(https://www.ons.gov.uk/datasets/create/filter-outputs/74d10602-c5e1-484b-a316-83517aeabb9f)
(https://www.nomisweb.co.uk/datasets/c2021ts054)
2001 census - ST111 - Tenure and number of cars or vans by ethnic group of Household Reference Person
(https://www.nomisweb.co.uk/datasets/st111)
2011 census - Tenure by ethnic group by age - Household Reference Persons
(https://www.nomisweb.co.uk/census/2011/dc4201ew)
2011 census - INFUSE; Scotland, Tenure by ethnic group household head
(http://infuse.mimas.ac.uk/)
2021 census - Tenure by ethnic group - Household Reference Persons
(https://www.nomisweb.co.uk/datasets/c2021rm134)
2021 census - Household: Tenure and Ethnic group - Northern Ireland
(https://build.nisra.gov.uk/en/custom/data?d=PEOPLE&v=LGD14&v=HH_TENURE_AGG5_PERS&v=ETHNIC_GROUP_AGG5)
2021 census - Country of birth (UK) and tenure of household
(https://www.ons.gov.uk/datasets/create/filter-outputs/536dca4c-78ef-44bc-b45e-343c20019dc9)
2021 census - Tenure of household and year of arrival in the uk
(https://www.ons.gov.uk/datasets/create/filter-outputs/0f36c53e-83bb-43c9-b4f5-72543f0c6b4b)
2021 census - Ethnic group and tenure of household
(https://www.ons.gov.uk/datasets/create/filter-outputs/fee5e359-92f5-4492-81d7-a8a0d7da7cbc)
2021 census - Age and tenure of household
(https://www.ons.gov.uk/datasets/create/filter-outputs/5efd4c66-da13-484e-80c2-3599baf5b3df)
2021 census - Household size and tenure of household
(https://www.ons.gov.uk/datasets/create/filter-outputs/05dab3a2-f10b-42cd-b1d8-3344da0916e1)
2021 census - Religion and tenure of household
(https://www.ons.gov.uk/datasets/create/filter-outputs/86f247ff-a31a-46b2-ac21-568e5fc50a2e)
2021 census - Highest level of qualification and tenure of household
(https://www.ons.gov.uk/datasets/create/filter-outputs/69c15e02-3d02-4966-b07a-0fffa46b58f5)
2021 census - Accommodation type and tenure of household
(https://www.ons.gov.uk/datasets/create/filter-outputs/7b06858e-33e6-481e-a50f-e2244e7be141)
2021 census - Household composition and tenure of household
(https://www.ons.gov.uk/datasets/create/filter-outputs/475a9654-7300-4370-88da-eb3b24bebb4c)
2021 census - Occupation (current) and tenure of household
(https://www.ons.gov.uk/datasets/create/filter-outputs/643aaa37-1185-40e1-9b99-294ea9719d5a)
2021 census - Industry (current) and tenure of household
(https://www.ons.gov.uk/datasets/create/filter-outputs/18745e11-ad9d-4951-b62b-874f1783b611)
2021 census - Economic activity status and tenure of household (household head)
(https://www.ons.gov.uk/datasets/create/filter-outputs/bd3a750b-3324-41d5-b359-f90a6656cf31)
2021 census - Economic activity status and tenure of household (usual residents)
(https://www.ons.gov.uk/datasets/create/filter-outputs/df4ebbe4-889c-4333-b59e-29f44dd3a8e7)
2021 census - Age, economic activity status and tenure of household
(https://www.ons.gov.uk/datasets/create/filter-outputs/ec184b5f-b12f-42fc-ac74-9b8d7fc246b0)
2021 census - Age, economic activity status, sex and tenure of household
(https://www.ons.gov.uk/datasets/create/filter-outputs/c1c06e18-cee9-4e4c-95fd-fb118953b75b)
Other sources:
Live tables on housing supply: indicators of new supply - GOV.UK; Tables 244 and 253
(https://www.gov.uk/government/statistical-data-sets/live-tables-on-house-building)
Effects of taxes and benefits on UK household income: financial year ending 2019
(https://www.ons.gov.uk/peoplepopulationandcommunity/personalandhouseholdfinances/incomeandwealth/bulletins/theeffectsoftaxesandbenefitsonhouseholdincome/financialyearending2019#household-income-by-ethnic-group)
Crime statistics and outcomes from data.police.uk
(https://data.police.uk/)
Metropolitan Police FOI database for Crime and Ethnicity
(https://www.met.police.uk/foi-ai/af/accessing-information/published-items/?q=ethnicity)
Gun crime and robbery; ethnicity of suspects and victims in London - FOI - 2010 to 2020
(https://www.met.police.uk/SysSiteAssets/foi-media/metropolitan-police/disclosure_2020/december_2020/ethnicity-perpetrators-victims-gun-crime-robbery-januar2010-october2020.xlsx)
Deaths due to knife crime by ethnicity of suspect and victim in London - FOI
(https://www.met.police.uk/foi-ai/metropolitan-police/disclosure-2020/december-2020/deaths-due-to-knife-crime-from-2014-to-2019/)
Victims and suspects of hate crime in London, by ethnicity - FOI
(https://www.met.police.uk/foi-ai/metropolitan-police/d/march-2022/ethnicities-of-victims-and-suspects-of-hate-crimes-from-january-2016-to-january-2022/)
Shapefiles:
Casweb UK Data Service
(https://borders.ukdataservice.ac.uk//easy_download.html):
Walford, N (2006). 1981 Census: boundary data (England and Wales) [data collection].
UK Data Service. SN:5819 UKBORDERS: Digitised Boundary Data, 1840- and Postcode Directories, 1980-. http://discover.ukdataservice.ac.uk/catalogue/?sn=5819&type=Data%20catalogue
Retrieved from http://census.ukdataservice.ac.uk/get-data/boundary-data.aspx.
ONS Open Geography Portal
(https://geoportal.statistics.gov.uk/):
ONS Geography - Middle Layer Super Output Areas (2021) Boundaries EW BFC
(https://geoportal.statistics.gov.uk/datasets/ons::middle-layer-super-output-areas-2021-boundaries-ew-bfc/explore?location=52.800414%2C-2.489483%2C7.81)
ONS Geography - LSOA (Dec 2001) EW BFC
(https://geoportal.statistics.gov.uk/datasets/ons::lsoa-dec-2001-ew-bfc/explore?location=52.800410%2C-2.489845%2C7.81)
ONS Geography - Lower Layer Super Output Areas (2021) Boundaries EW BFC
(https://geoportal.statistics.gov.uk/datasets/ons::lower-layer-super-output-areas-2021-boundaries-ew-bfc/explore?location=52.423202%2C-0.068777%2C7.81)
The ONS definition of a tenure which is classed as socially renting is: ‘social rented through a local council or housing association’.
The 1981 census graphics (enumeration districts) do not use the same boundary set as the 2001-2021 graphics do (LSOAs). Even though in practice this is not of great importance, please bear this in mind when analysing.
For clarity, the statistics presented in these sections of the article, unless otherwise indicated will be using the metric of ‘Household Reference Person’ (HRP) – usually the household head, which I often use interchangably to refer to the HRP – who is typically used to denote a household’s features, such as economic activity, employment status, etc. For example, if we want to denote whether a household is economically active or inactive, we can look at whether or not the HRP is. More on this can be found here and here.
The ethnic groups are presented in ‘broad groups’, due to limited data on the census for the normal 19+1 census ethnic groups. Please visit the dataset listed in the sources above for clarity on data limitations on the ONS website.
Northern Ireland’s statisics use ‘present residents’, unlike both Scotland and England and Wales, which use the ‘household head’. These two different units, however, should not greatly affect the percentages (1-2% at best), and are thus comparable.







![[animate output image] [animate output image]](https://substackcdn.com/image/fetch/$s_!1a_8!,w_1456,c_limit,f_auto,q_auto:good,fl_lossy/https%3A%2F%2Fsubstack-post-media.s3.amazonaws.com%2Fpublic%2Fimages%2Fac6fec3a-34e7-42b5-8647-d63d0055d12d_1200x861.gif)



Excellent analysis. I've also seen statistics based on tax receipts from the US and, I think, Holland (or maybe Denmark) indicating that blacks are massively revenue negative, as are Arabs and Hispanics albeit less so. All exactly as would be expected from IQ statistics.
I can't help but wonder if this connects to the birth rate problem. The considerable subsidies afforded recent migrants are paid out of the pockets of the native born, who then must contend with higher taxes, flattened wages, and increased housing costs, all of which make family formation less affordable.
Incredible work. Thank you.