
The entitlement state
How entitlements cannibalised public investment and destroyed British productivity
Since 1955, British government spending has generally averaged around 40% of annual GDP. While today’s level is above this post-war average, there is no evidence of any systematic, long-term growth in government spending as a share of GDP:
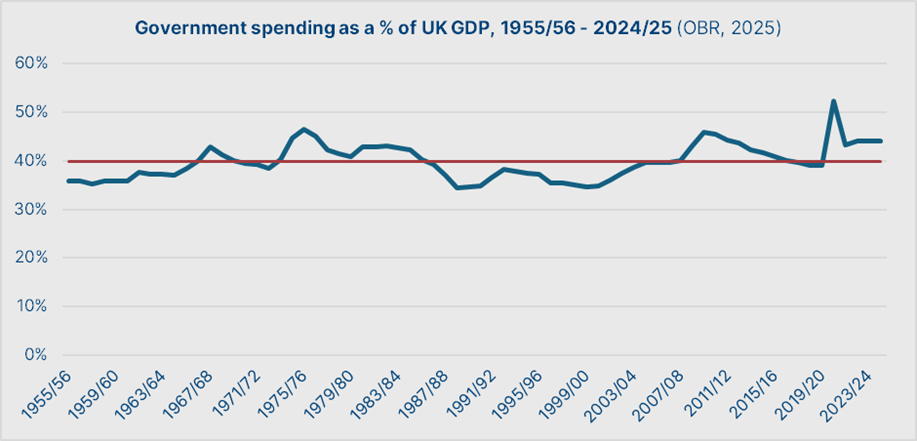
What has changed is how this spending is allocated. This change in allocation is not found in day-to-day public services spending: over the last seventy years, public services spending has remained relatively stable at around 22% of GDP. Neither is this change to be found in spending on the depreciation or debt interest burden, which together have consistently averaged around 6%. Rather, the change has been in the two other categories of government spending. On the one hand, there are entitlements: cash transfers to the public, including benefits and pensions. On the other hand, there is public investment: spending on new infrastructure, utilities, and facilities.
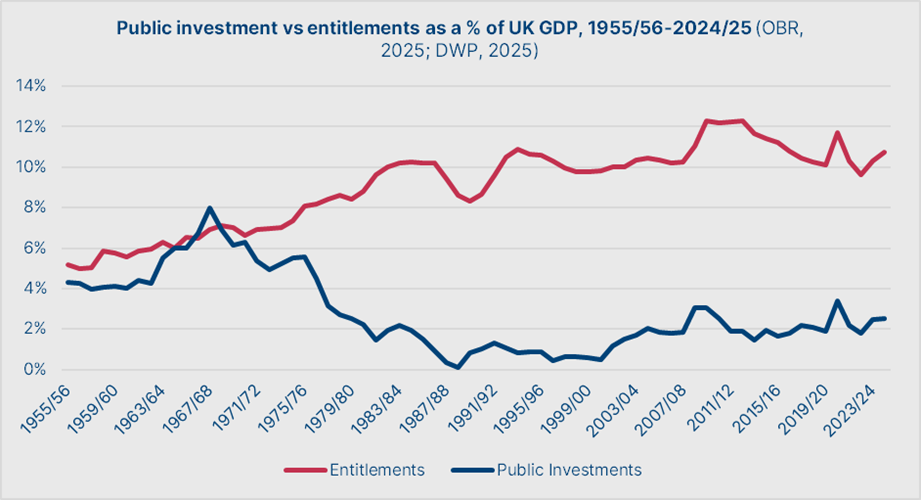
Between 1955 and 1975, there was a general equality in the entitlement versus investment allocation. Each represented an average of around 5-6% of GDP per annum. However, from the mid-1970s onwards, this general equality vanished. By the middle of the subsequent decade, entitlements stood at around 10.2% of GDP and public investment at 1.9%. This allocation has remained roughly the same ever since:
This cannibalisation of public investment by entitlement spending is a fiscal paradigm that we shall label the entitlement state. In this piece, we will explore:
The harms of the entitlement state;
How the entitlement state came to be; and
How we might construct an alternative.
The costs of the entitlement state
The main costs of the entitlement state are reflected in its opportunity cost, since it is financed by spending that was previously reserved for public investment.
Before 1975/76, public investment represented a major source of British net investment. Net investment is essential for long-term economic growth — it represents growth in equipment, plant, and infrastructure that reduces the requisite time and labour to produce a given output. Growth in labour productivity is ultimately the main driver of growth in wages and living standards, and the size of an overall economy.
Thus, a fall in public investment must reduce growth in wages, living standards, and economic output unless it is substituted by a corresponding rise in private investment. However, this has not happened. Public and private investment are not interchangeable.
This is because the role of public investment is to direct capital towards low-return or non-rivalrous goods and services, which often prove difficult to finance or profitably operate under private ownership, but generate significant returns across the whole economy.
This can be via:
Improving the productivity of individual workers, such as by giving them access to more efficient and reliable transport infrastructure.
Raising the return on capital for private investment, such as by reducing the electricity bills for factories through investment in power stations and transmission infrastructure.
Critically, then, this means that a fall in public investment does not merely have a direct impact on the livelihoods and productivity of individual workers. In the long run, it discourages private investment by reducing its return on capital.
The data shows that this is exactly what has happened since 1975:
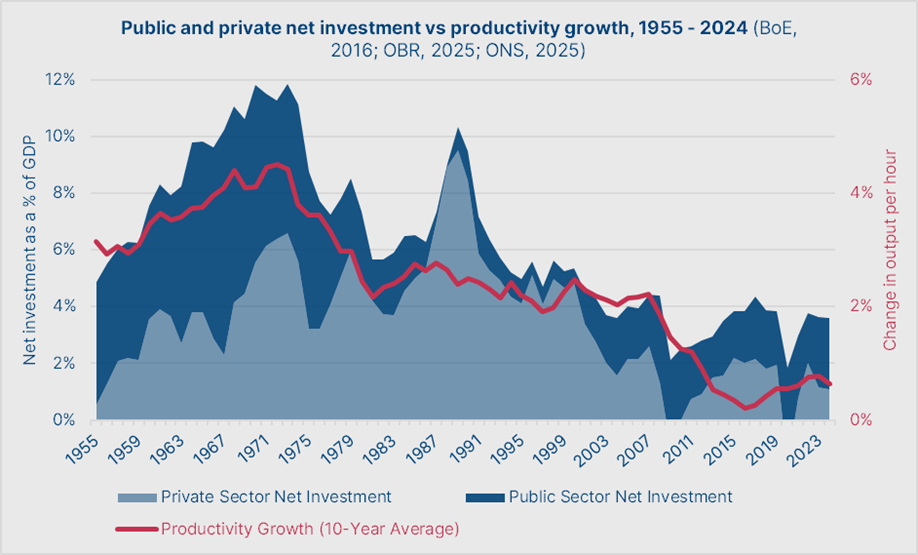
The above chart shows public and private investment since 1955 on the left axis, and on the right axis shows the ten-year average for productivity growth — what we’ll refer to from now on as ‘structural’ productivity growth. As the chart shows, structural productivity growth has marched in lockstep with net investment. The fall of public investment in the second half of the 1970s saw it collapse from 4.4% in 1973 to 2.2% in 1981.
Private investment and structural productivity growth both stagnated for the subsequent two decades, apart from the brief spike of the Lawson Boom. However, private investment then began to collapse between 1999 and 2003, with net investment levels only stabilised by a slight restoration of public investment under Blair. Aside from the shocks of the 2008 Financial Crisis and the Covid Pandemic, this net investment composition has remained in place for the past two decades. Under it, structural productivity growth has fallen to its current dismal low of roughly 0.65% per annum.
In short: productivity growth and private investment rose in lockstep with public investment growth between 1955 and 1975, and then stagnated once it fell. At almost exactly the time that most public investments began to reach the end of a typical 25-year depreciation schedule, private investment began to fall off, and structural productivity growth fell to its current low.
How much has the collapse in public investment cost Britain? We can perform a simple regression to estimate this:
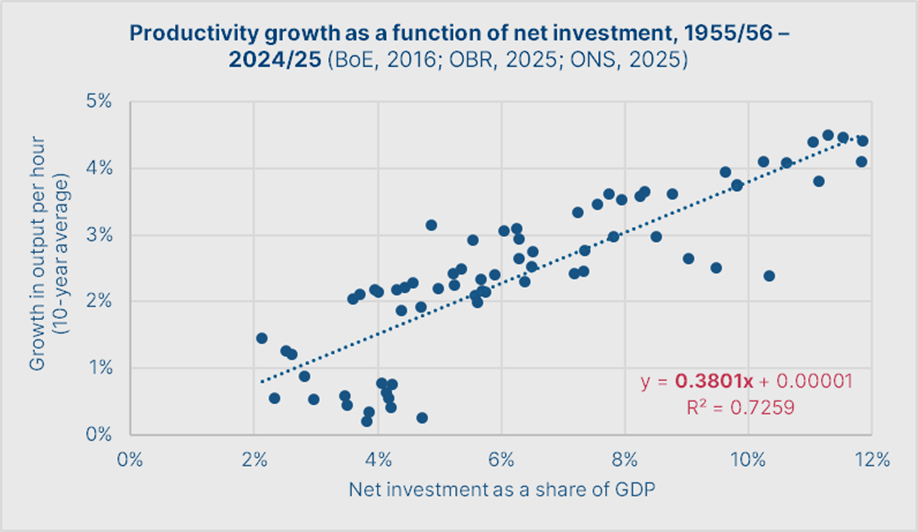
Across the post-1955 period, a 1% rise in net investment as a share of GDP is associated with an increase in structural productivity growth of 0.38%. This correlation is quite strong for a macroeconomic relationship, with an R2 value over 0.7.
If, as we have claimed, the low-return and non-monetisable nature of public investment means it does not have a crowding-out effect on private investment, then a 1% fall in public investment as a share of GDP reduces structural productivity growth by 0.38%.
Compared to 1955-75, average public investment during the 1975-2025 period represented a 3.6% lower share of GDP. This suggests a reduction in structural productivity growth of around 1.37%.
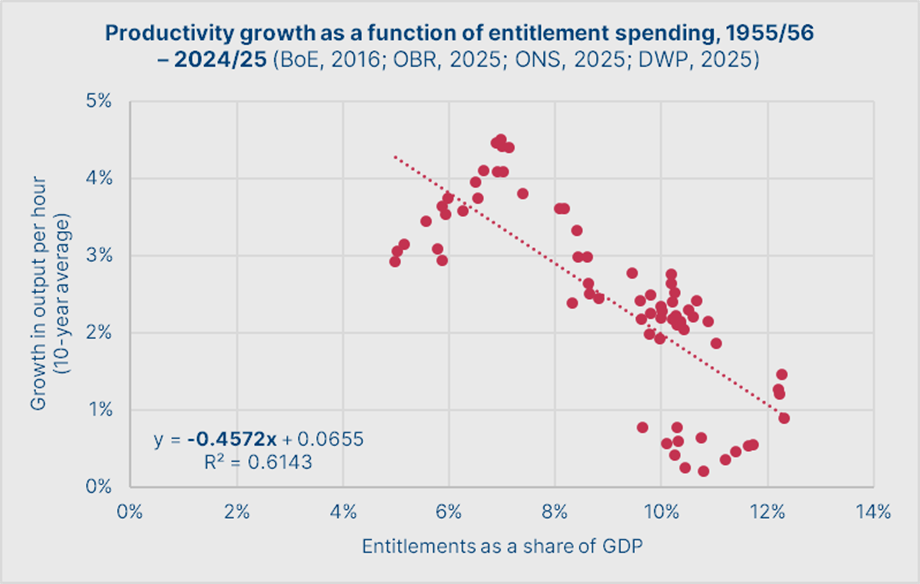
On the other hand, we can see that entitlement spending has a broadly negative relationship with productivity growth. On the face of it, a percentage point rise in entitlement spending as a share of GDP reduces structural productivity growth by 0.46%. In a best-case scenario, this suggests greater entitlement spending is productivity-neutral, aside from its role in cannibalising public investment — although there are reasonable grounds to believe there may in fact be a slightly negative relationship.
Even if we assume this generous productivity-neutral interpretation of the effects of entitlement spending, however, a reduction in structural productivity growth of 1.37% is grave for the nation.
In 2023 prices, actual output per hour was approximately £45.20 as of 2024. With higher per-annum productivity growth of 1.37% since 1975, per hour would have instead stood at around £87.11:
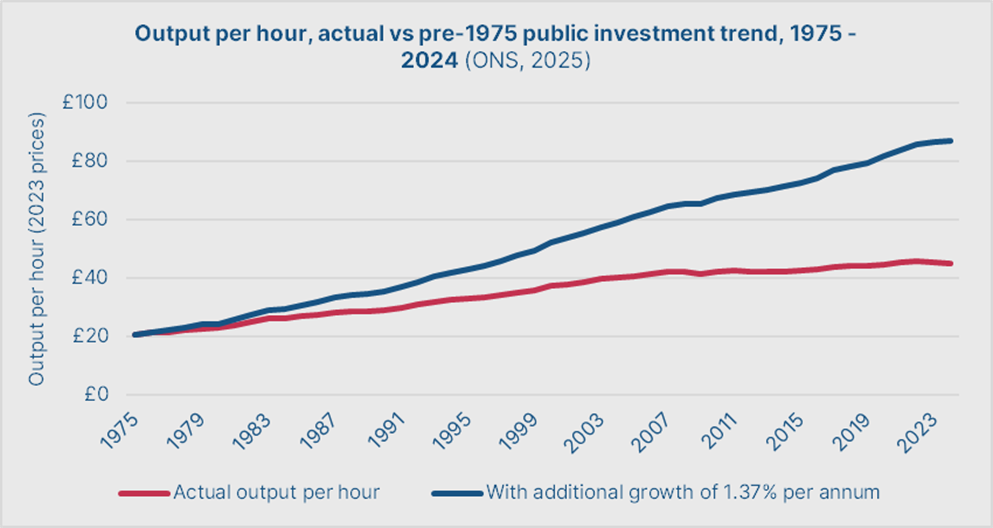
That is to say, according to this analysis, that output per hour is nearly half of what it could have been had public investment not collapsed in the 1970s. Of course, any projection like this should be taken with a pinch of salt, but the idea that British productivity could have reached these levels is not at all unreasonable. At £87.11, our output per hour would be roughly in line with that of Denmark, the Netherlands, or Belgium today — instead, it is closer to that of Spain.
In terms of Gross Value Added (GDP before taking the net effect of product taxes and subsidies into account), this represents a reduction from around £4.9tn to £2.5tn.
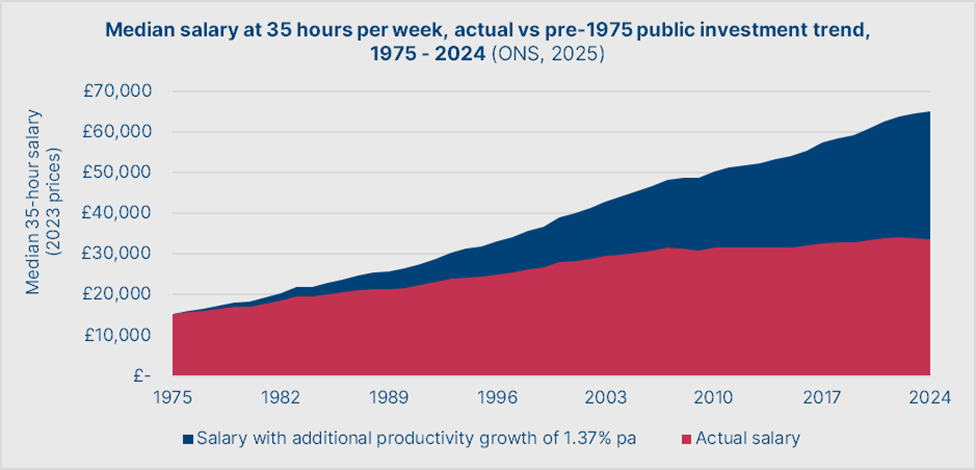
If we assume our more productive Britain had the same output-to-wage ratio, then we can illustrate the effect of this lower productivity on incomes: whereas the median 35-hour income today is £34,500, it would instead be £65,630 in a world with higher post-1975 structural productivity growth.
We are all poorer because of the collapse in public investment post-1975. While economic cycles happen, while individual debates on particular spending items keep going, this structural change has inexorably played itself out.
The causes of the entitlement state
One of the primary architects of the post-war economic system was Sir Stafford Cripps. Between 1942 and 1945, Cripps had served as the Minister of Aircraft Production, where he had overseen the transition from fighter to bomber production. Even before his start in this role, Cripps believed fervently that real economic growth was intrinsically tied up with questions of material production. But oversight of the strategic bombing campaign and its role in shortening the war — and his successful doubling of deliveries of bombers through a relentless focus on productivity and efficiency — had solidified this conviction and laid the groundwork for a new vision of economic management.
As President of the Board of Trade from 1945 to 1947, Cripps focused most of his energies on developing a state planning capability to consistently deliver such productivity growth. This continued with even more vigour when he served as Chancellor of the Exchequer from 1947 to 1950, as he said to the House of Commons:
‘I cannot emphasise too strongly that, however we manipulate our trade or finance, whatever political system we follow, and whatever arrangements we make with other countries, the fundamental fact must always remain that our standard of living as a people will and must depend upon the volume of our own production, and nothing can give us a higher standard than we can support by our own efforts.’
‘In order to get this increased production, we must carry out our planning in an orderly way. We must secure raw materials and sources of power first of all for producing things like coal, steel, transport, agricultural production, and those primary things that are the basis of the whole of our industrial life, and, having secured a sufficiency of those primary things, we can then turn to the semimanufactured goods of importance, and finally to the completely manufactured goods.’
The concept of medium to long-term planning was at the heart of Cripps’ vision — and the idea that it was the role of governments to direct the long-term direction of economic development. The intuition behind this was simple: a modern industrial economy requires multi-decade coordination of capital and labour, which neither capital or labour alone can reliably provide themselves. Public investment and long-term state planning were required to increase structural productivity and nurture these modern industries.
Ultimately, the seeds of the system’s destruction were sewn when this idea of long-term planning failed to outlive Cripps and his government. Instead, starting in the 1950s, Britain fell into a pattern of reactive economic management that came to be derided as the ‘stop-go’ system owing to the frequent changes in the economic weather it produced.
Under stop-go, governments aimed to maintain near-full employment and low inflation while maintaining a fixed exchange rate. During a ‘go’ phase, governments sought to stimulate demand by cutting taxes, increasing spending, and slackening the bank rate and credit controls. Inevitably, the inflationary pressure combined with the fixed exchange rate would see foreign exchange reserves run down over time during the go phase. When the reserves were sufficiently run down to threaten the flow of imports, governments then entered a ‘stop’ phase where taxes were re-raised, spending was cut, and the bank rate and credit controls tightened.
This system was inherently unstable, principally because the proximate metrics with which it measured success — unemployment and inflation — were decoupled from structural productivity growth. This meant that long-term strategies to allocate capital and labour to productivity growth were not possible, owing to frequent changes in market conditions and investment priorities.
Perhaps the reactive stop-go system’s biggest problem was the way in which it encouraged political cynicism: governments could try to manipulate the timing of the stop-go cycle to gain political advantage. Completely divorced from productivity growth, serving governments had an incentive to ensure that elections lined up with transient spikes in growth during a ‘go’ phase.
This came to a head during the Heath government. Keen to produce the most impressive surge in growth on record ahead of elections anticipated for 1974/75, Chancellor Anthony Barber delivered a budget in 1972 that targeted a growth rate of 10% per annum. Barber’s targeted growth rate was 2.5 times that of on-trend improvements in productivity, which was then at around 4%. To achieve this surge in growth, he targeted a turbocharging of consumption via a dramatic liberalisation of bank lending and a wave of tax cuts. Inevitably, this resulted in the economy beginning to overheat and a rate of CPI inflation of 9.2% in 1973. The late 1973 global energy crisis saw this cynical gamble blow up in Barber’s face, with inflation hitting 24.2% by 1975.
This utterly broke the premise of the stop-go system. While much of the world struggled with high inflation, the inflationary premium from Barber’s 1972 measures meant that Britain’s foreign exchange reserves were depleted far faster than anticipated, and a ‘stop’ was urgently needed — one that was more severe than any that had come before. The attempt to implement this stop, particularly through stemming the wage-price spiral by capping public sector wage growth, was what brought down the Heath government.
It was then left to the Labour governments of Wilson and Callaghan to attempt to find a solution to this general crisis. This culminated in the 1976 IMF loan, whose conditions included significant cuts to public spending — with capital spending and public investment being the most politically viable immediate candidates for the cuts. In addition, the inflation controls demanded by the IMF also required renewed wage suppression by the state to stop the wage-price spiral. The latter point ultimately doomed the Labour government, and the post-war economic order.
In 1979/80, Margaret Thatcher inherited a budget that allocated just 2.5% of GDP to public investment, down from 6.3% in 1970/71. Most of the investment cuts had already been made, albeit under the belief they would be of a temporary nature. What changed under Thatcher was entitlement spending. She inherited a budget that allocated 8.4% of GDP to entitlements — slightly above the pre-1975 average, intended temporarily to offset the worst cases of economic dislocation produced by the drawdown of public investment and the closure of unprofitable state enterprises. By 1986/87, this share had risen to 10.2% of GDP.
Aside from her temporary attempt to reverse this trend from 1987-91, entitlements have been above 10% of GDP ever since. What caused this? It was not the intention of Thatcher herself, who was sincere in her belief that state spending should be limited to 30-35% of GDP: if levels of spending on public services and debt/depreciation held constant, as they have, this would have limited her to 5-8% of GDP for entitlements. Entitlements came to plug the investment gap out of political expediency — heightened entitlement spending became a key tool to paper over the economic dislocation produced by the end of the post-war economic settlement.
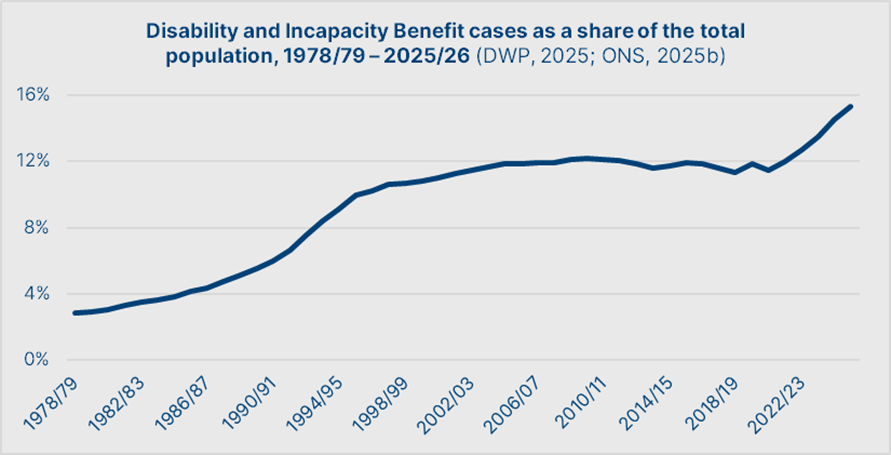
An apt example of this phenomenon is the explosion in disability benefit in the late 1980s and early 1990s. These benefits saw an exceptionally high claimant ratio in deprived regions dealing with the impacts of deindustrialisation. In practice, these benefits allowed governments to disguise unemployment and underemployment and avoid making difficult decisions about the future of regional economies and their inhabitants.
While initially an expediency in dealing with difficult challenges associated with the economic dislocation under the new order, the moral status of such entitlements evolved. For much of the public, entitlements are no longer seen as a safety net or an insurance policy, but as a key obligation that they expect from the state. The electorally ‘smart’ response for politicians has increasingly been to cater for these expectations.
This has become especially true considering a post-2008 phenomenon. Most people now live in households that take more in benefits than they pay in taxes:
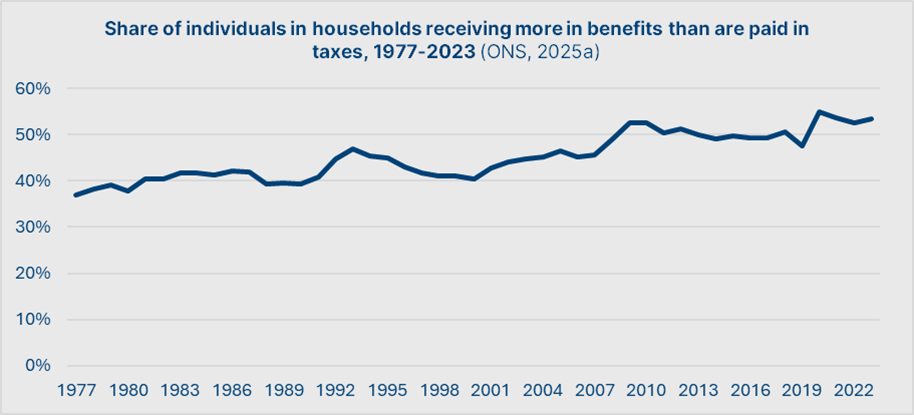
If most people live in net beneficiary households, an electorate’s proximate interest ceases to be aligned with the long-term viability of the system. Instead, it becomes about securing access to their own entitlement transfers, since net beneficiaries are not exposed to the costs of financing their benefits. The rest is, sadly, simple arithmetic. In a competitive party system, electoral success will come to those who promise to continue — or even heighten — the transfers.
This is an unsustainable arrangement, because it ultimately means an ever-smaller share of the population is responsible for keeping the system solvent. Today, if you count cash benefits and benefits in kind, just the top thirty per cent of households remain net taxpayers. And, for the most part, the entire system is propped up by the top decile:
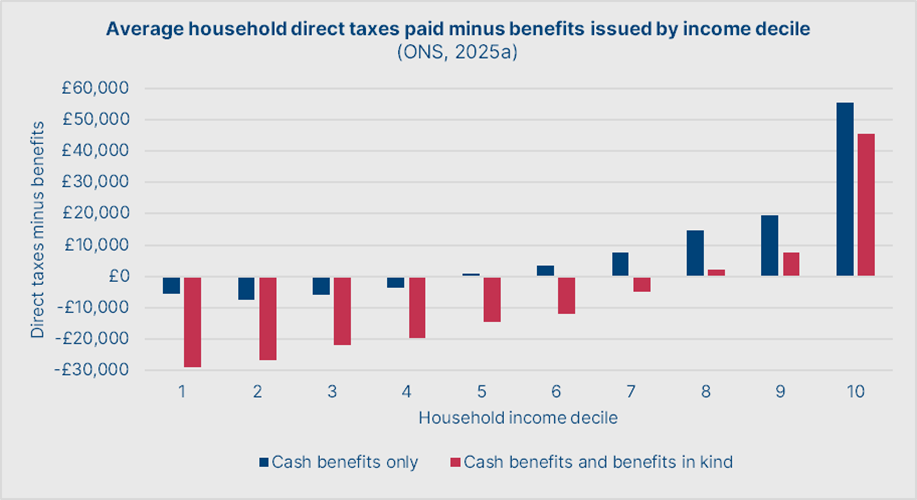
Capital flight and/or emigration would be disastrous for the public finances. And it is a real risk, since they are offered little in the way of an incentive to continue to subsidise the system.
We should find this deeply troubling because such a collapse in the public finances and loss of credibility on the bond markets would inevitably cause a sovereign debt crisis. This would not just invite a revision of the more egregious spending habits of modern British governments, but would lead to a deeply disruptive and unplanned overnight collapse of the social democratic state, its protections, and the services it provides. The necessity of fiscal readjustment does not mean that the damage caused by such a forced shock transition would not be real. The question, then, is not whether the entitlement state can be preserved. Instead, the question must be whether we choose to dismantle it on our own terms, or allow an uncontrolled explosion which will scar generations of Britons.
The promise of an alternative
Winding down the entitlement state would once again free fiscal headroom to restore public investment and drive productivity growth. A rough restoration of the pre-1975 pattern of spending would imply, as a long-term average, 22% of GDP on public services, 6% on debt and depreciation, and an equal 6% split between entitlements and public investment. Crucially, a restoration of this pattern of fiscal allocation does not necessarily mean a restoration of pre-Thatcher economic management. Public investment should not be used as a reactive tool to manage the impact of economic cycles. Instead, public investment must be treated, first and foremost, as a tool to raise structural productivity growth.
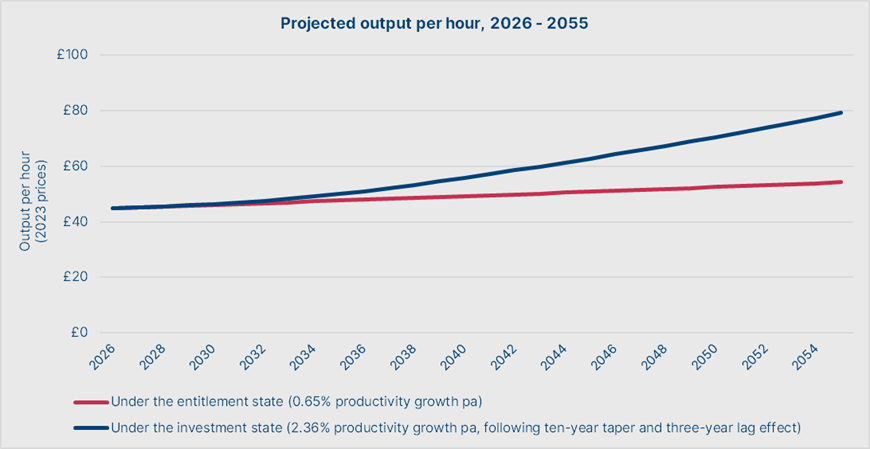
Such an approach would not only avoid the kind of challenges that the post-war system ran into in the 1970s. One can also reasonably expect the productivity gains from public investment to be higher under a system which regards precisely that as the end of investment, rather than a pleasant by-product of investment directed according to other, competing concerns. A reasonable estimate would be that a return to a 6% allocation of GDP to public investment would increase structural productivity growth by 1.71%, to 2.36% per annum (from 0.65% today).
The result, within thirty years, would be an increase in output per annum from its real on-trend level of £54.23 to £79.25. This would represent a roughly 50% increase in gross value added nationally. For the median person working 35 hours per week, this forecasts a salary rise from £41,160 under the current trend to £59,700.
As discussed, to finance this renewed public investment, we cannot afford to raise taxes, given the current risk of capital flight and the magnitude of the present burden on the tax base. Neither can we significantly increase borrowing, given that our credibility is already tested on the bond markets. And so, we must cut entitlements. To achieve the desired level of public investment, the total reduction in the entitlement budget will need to be at least £128.2bn per annum. How those savings can be achieved is a subject for another article.
Conclusion
While most readers will recognise the necessity of this proposal, many might consider it electorally unviable at present. After all, it does require much of the electorate to renounce many of the benefits they receive under the entitlement state. However, I do not believe that voters are naïve automatons. In the past, the British public has shown itself willing to make short-term sacrifices to make long-term gains, so long as they are properly convinced.
Democratic politics does not have to result in a tragedy of the commons. Sectional interest does not have to prevail over the common good. The public can choose the national interest, if they are convinced — it is the task of political leadership to convince the public that such a national interest exists, and that it aligns with their enlightened long-term interest.
British political, economic, and social life has suffered greatly from our abandonment of productivism, which grounds us in the real and gives meaning to our daily activities. If we do not believe that our work makes a difference both to our individual prospects and the strength and prosperity of the nation, it should not be a surprise that our willingness to work has declined. Restoring Cripps’ understanding of the purpose and promise of labour as the basis of investment, and therefore of progress, is a necessary step towards restoring our understanding of its fundamental meaning in our lives. In this endeavour, the state must lead the way.
This article is an edited and expanded version of the speech given at the launch event of The Investment State, a new green paper on fiscal policy written by Matthew Kirtley for the Social Democratic Party (SDP). All sources for the figures cited and claims made above can be found in the green paper.
This article was written by Matthew Kirtley, a Pimlico Journal contributor. Have a pitch? Send it to submissions@pimlicojournal.co.uk.
If you enjoyed this article, please consider subscribing. If you are already subscribed, why not upgrade to a paid subscription?
tough optically when 50%+ of the entitlement budget is pensions, but agree
I liked your article and the analysis. At the age of 75 now, I can see how things are just getting worse and worse and realise where it all started to go wrong. Terrible roads and other poor infrastructure are not the result of recent events, or even Brexit, but have been coming because of underinvestment over decades.
But the way back out of it? With very few politicians of the right calibre, and turkeys not voting for Christmas, I cannot see a solution beyond a revolution.